

On September 3rd, ETH dipped to below $2,370 during the session before returning above $2,400, with the short-term downward trend temporarily slowing down. However, looking at the 4-hour trend, market momentum has not yet significantly recovered, and the resistance area above $2,430 continues to suppress any rebound attempts.
Temporarily stabilized above $2,400
As of press time, ETH is trading at $2,408, up 0.66% for the day, with intraday ranges between $2,370 and $2,419. After the price once again surpassed $2,400, market sentiment stabilized to some extent, but it has not yet recovered to the level around $2,438, nor has it entered the main resistance zone between $2,500 and $2,550.
After a round of gains at the end of August that met resistance around $2,550, selling pressure continued to appear in the upper regions. In the short term, ETH has begun to show lower stage highs, indicating that the pace of the rebound has slowed down.
4-hour indicators remain weak
From the 4-hour chart, ETH is still below the middle band of the Bollinger Bands at around $2430, which constitutes the first level of resistance at present. If the price manages to rise above this level again, the market may test the $2450 range once more and move closer to around $2493.
However, the short-term momentum remains weak. The 4-hour RSI is at 43.86, still below the 50 neutral line, indicating that the buying force has not yet formed a clear reversal. The lower edge of the Bollinger Bands is around $2366, close to the intraday low, suggesting that this area is the nearest support zone.
If the level of $2,366 is breached, market attention may shift back to $2,350. If the daily or weekly chart closes below this level, the $2,200 region could once again come into focus.
The daily chart still retains the repaired structure.
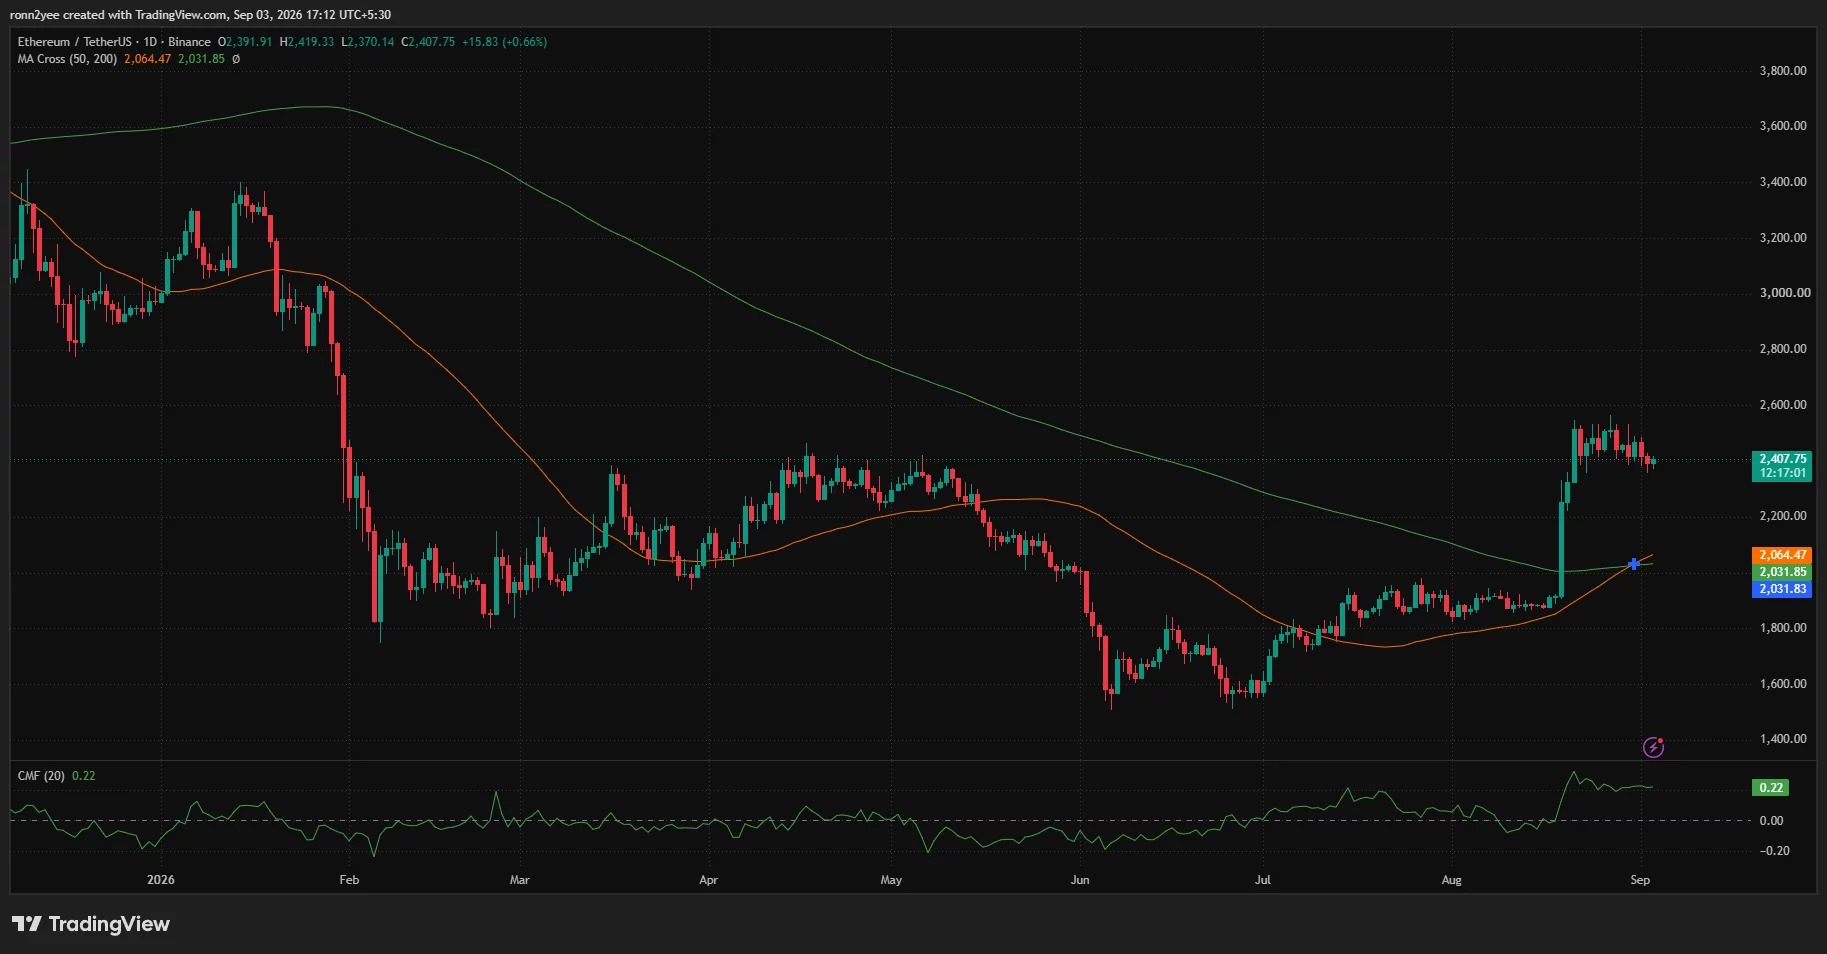
Despite short-term pressure, the daily structure of ETH remains relatively stable. The current price is still above the 50-day moving average of $2064 and the 200-day moving average of $2031, and the 50-day moving average has crossed above the 200-day moving average, indicating that the medium-term trend has improved compared to before.
The Capital Flow Indicator CMF is currently at 0.22, indicating that during the statistical period, the buying pressure was still stronger than the selling pressure. However, since this indicator broke through in August, it has tended to flatten, suggesting that the inflow of new capital has not continued to accelerate.
The liquidation hot zones are distributed on both sides.
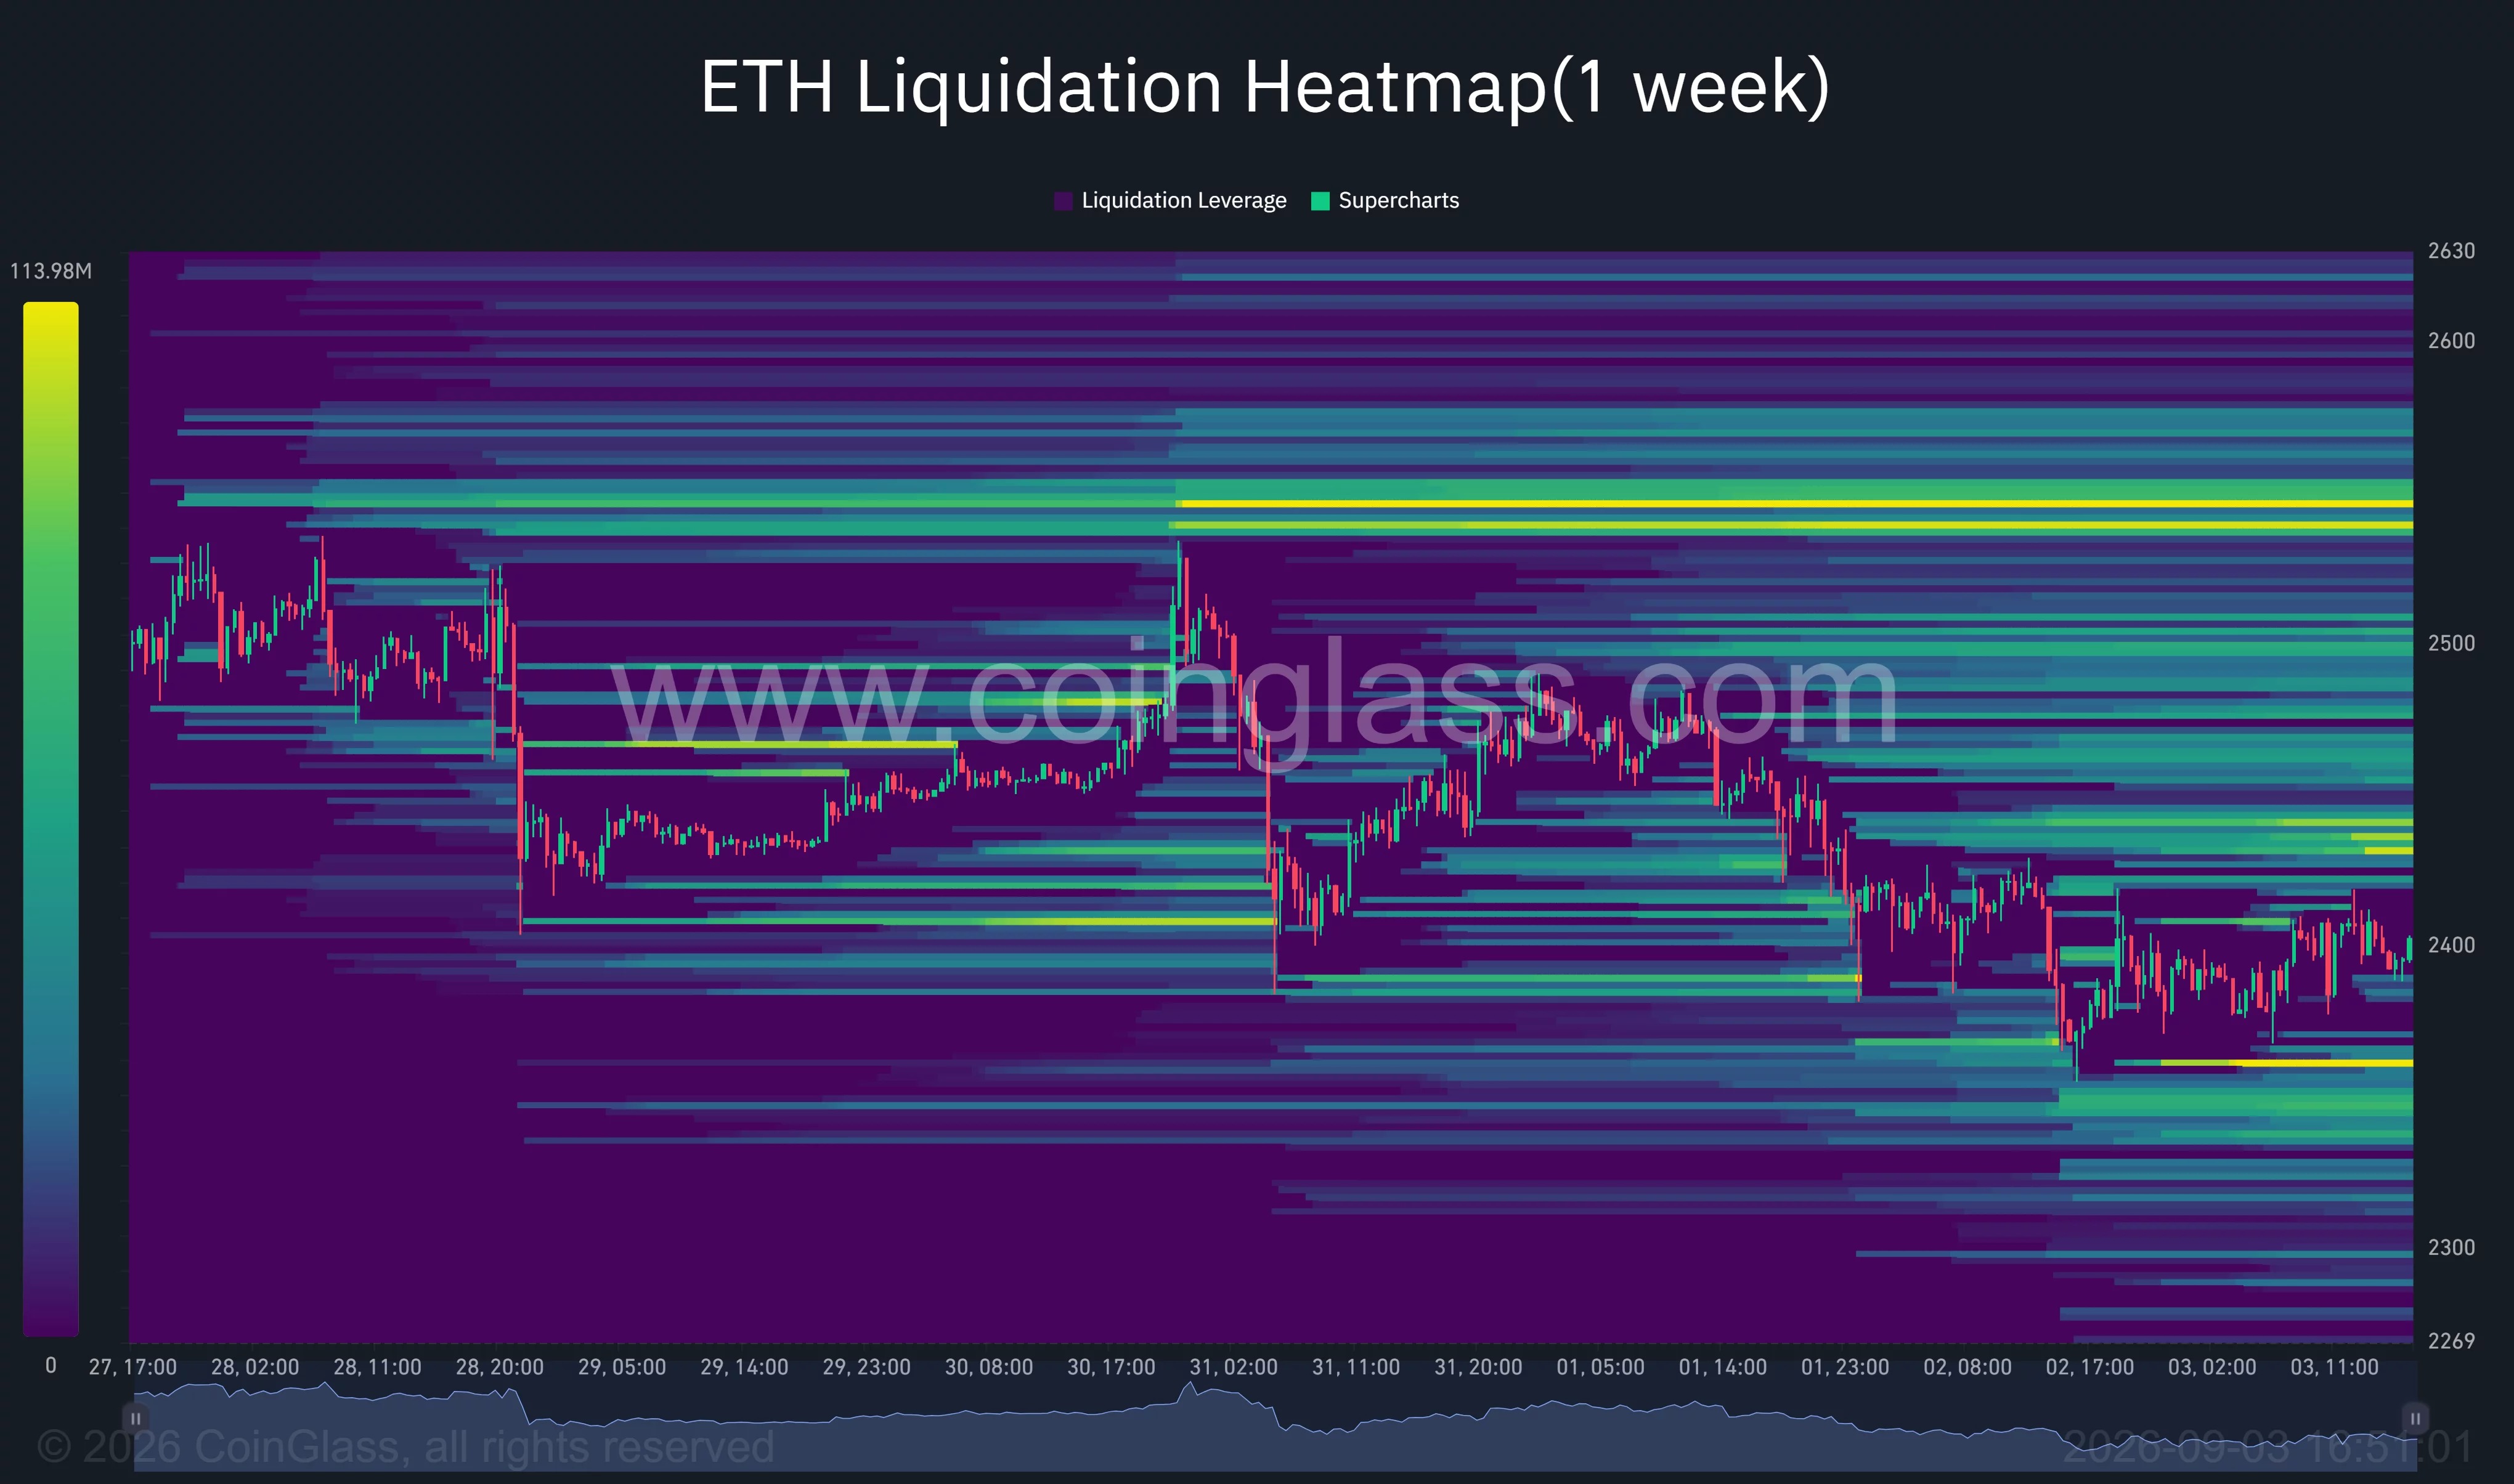
The one-week clearing heat map of CoinGlass shows that there are a significant number of leveraged positions gathered both above and below the current price of ETH. The nearest clearing-intensive area below is between $2350 and $2360; once the price falls back into this range, it may trigger passive liquidation of long positions, exacerbating short-term selling pressure.
At the same time, liquidity has also accumulated in the range of $2,430 to $2,450. If the buying pressure holds above $2,400 and drives prices upward, this area could become a short-term target, potentially prompting some short sellers to close their positions. The main clearing zone at higher levels is between $2,535 and $2,550, which roughly coincides with previous highs and the resistance areas that the market is paying attention to.
Overall, although ETH has once again reached the $2400 level, the short-term trend has not yet fully strengthened. Moving forward, the range of $2350 to $2400 will continue to provide support, while the area between $2430 and $2550 will be the main resistance zone for whether the rebound can continue.