





Foreign media reports that after Bitcoin rebounded in August, the 50-day and 100-day moving averages are converging, and the market is watching to see if a "golden cross" signal will form in the medium term. However, the article argues that what will truly determine whether this structural trend can continue to strengthen is not the crossover of the moving averages themselves, but whether the price can hold above the resistance range of $80,000 to $82,000.
After the rebound in August, the moving average structure improved.
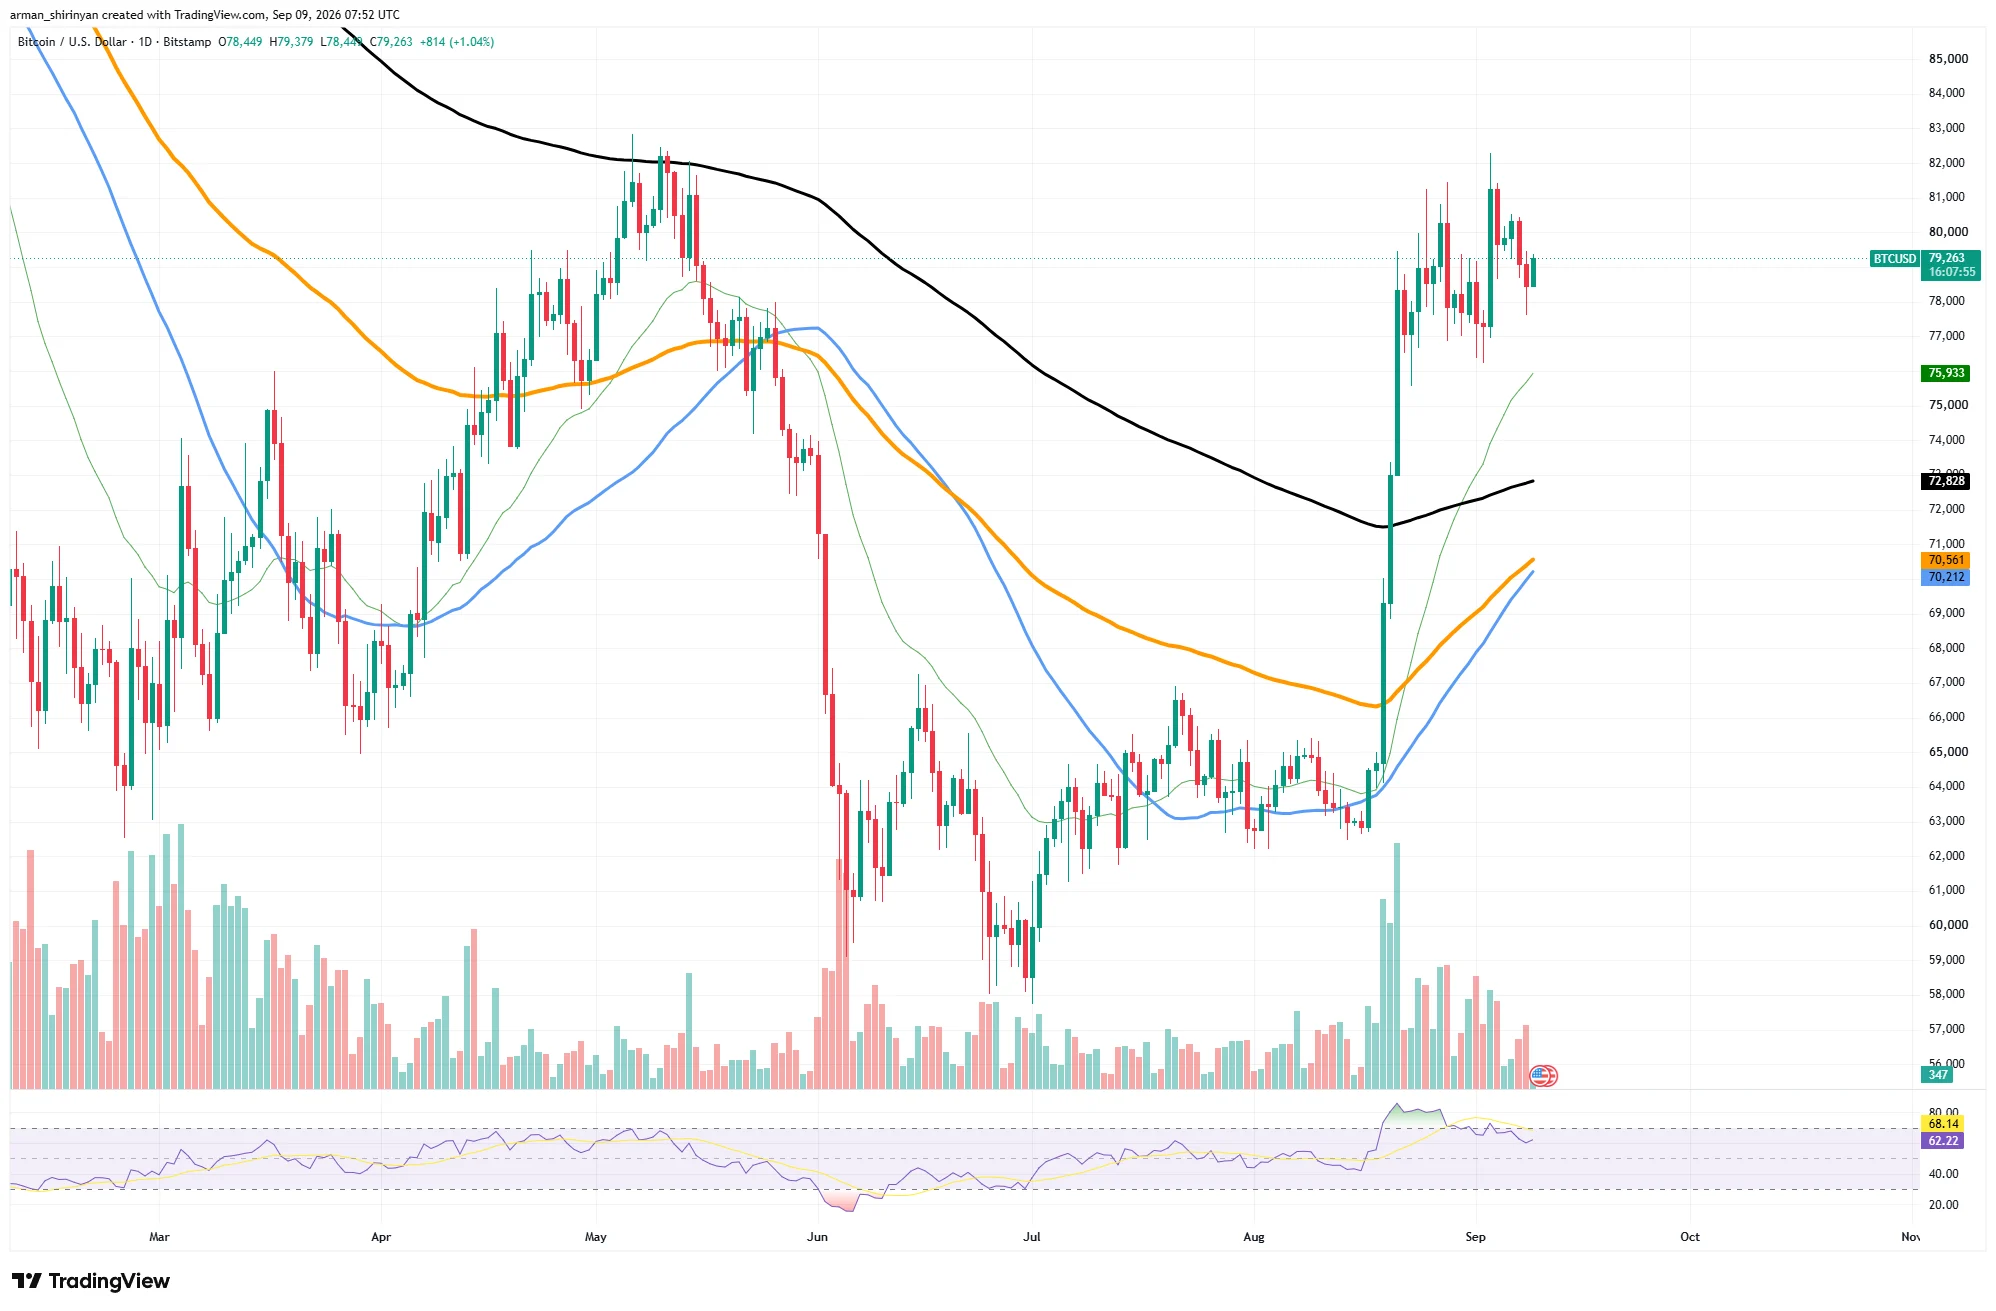
The article mentions that after Bitcoin rebounded from a low of around $58,000 in June, it was recently trading near $79,250. With the breakthrough in August, the short-term moving average has risen more rapidly, and the price has once again surpassed the 200-day moving average.
- The 200-day moving average is approximately $72,830.
- The 100-day moving average is approximately $70,560.
- The 50-day moving average is approximately $70,210.
Among them, the 50-day and 100-day moving averages are approaching convergence. If the short-term moving average crosses above the longer-term moving average, it is generally seen by the market as a confirmation signal of improving medium-term momentum.
The golden cross is more of a confirmation rather than a new starting point.
The article also points out that the crossover of moving averages is itself a lagging indicator. Before a signal is formed, Bitcoin had already risen from around $63,000 to above $80,000; therefore, a golden cross does not necessarily mean that a new round of upward movement will begin immediately.
According to this judgment, what is more worthy of attention at present is whether the price structure will continue to rise, rather than whether technical signals have just appeared. If the price merely maintains a high level, the significance of the golden cross will tend to confirm the previous rebound, rather than independently driving a new upward trend.
The area around $82,000 remains a resistance zone.
The article states that Bitcoin has previously encountered resistance in the range of $80,000 to $82,000 on several occasions. After reaching around $81,500 most recently, it fell back to around $79,000. Meanwhile, RSI has retreated from the overbought area to around $62, indicating that the bullish momentum is still present, although the growth rate has slowed down.
The article suggests that if the daily chart can close above $82,000, local resistance is expected to be broken through, with the next target range possibly being around $85,000. On the downside, support around $75,900 is initially considered, while the 200-day moving average is around $72,800. If the former level is lost, the bullish structure indicated by the golden cross will significantly weaken.
Overall, the article argues that the golden cross is strengthening Bitcoin's medium-term technical pattern, but the price still needs to break through to be validated. Before effectively surpassing the $82,000 level, this signal is more of a description of a rebound that has already occurred, rather than a guarantee of the next round of upward movement.