




XRP This week has seen a continued decline, with a cumulative drop of over 2% in recent days. From on-chain funds to contract positions, various data points indicate that sellers still hold the upper hand, which limits the short-term rebound potential. The market's current focus has shifted to the key support level near the 200-day moving average.
On-chain data is bearish compared to futures data.
The market summary for CryptoQuant indicates that there are signs of overheating in the XRP futures market, with relatively stronger selling pressure. Some retail funds are also participating in current trades. The spot market also shows certain signs of overheating, although other indicators remain in a neutral range.
Combining these data, the trading sentiment for XRP remains cautious, with an overall bias towards being bearish.
The long-short ratio has dropped to 0.83.
Data from the derivatives market further reflects a bearish bias. The long-to-short ratio of XRP fell to 0.83 on Tuesday, approaching a one-month low. A long-to-short ratio below 1 generally indicates that there are more short positions than long positions, suggesting that the market is betting more on a decline in the future.
At the same time, on Wednesday, the XRP funding rate turned negative, reaching -0.0012% on Thursday. The negative funding rate indicates that the position structure in the perpetual contract market is biased towards shorts, which also reinforces the currently weak market sentiment.
- Long-short ratio: 0.83
- Funding fee rate: -0.0012%
- This week's decline: over 2%
Price approaches the 200-day moving average
As of Thursday, XRP was trading around $1.392. Although the price has fallen, it is still above the 50-day, 100-day, and 200-day exponential moving averages. These moving averages are roughly distributed between $1.244 and $1.354, indicating that the medium-term structure has not been completely disrupted.
In terms of momentum indicators, the Relative Strength Index (RSI) is still in the upper middle range above 50, indicating that the bullish momentum has weakened, but it has not completely disappeared yet. The MACD line, on the other hand, remains below the zero axis, reflecting that the upward momentum continues to slow down.
Currently, the market is primarily focusing on the support level around $1.354, which corresponds to the 200-day moving average. If this level is broken, prices could further decline to around $1.300, and then test the areas of the 50-day and 100-day moving averages. If the downward trend continues, the next more significant support level is around $1.000.
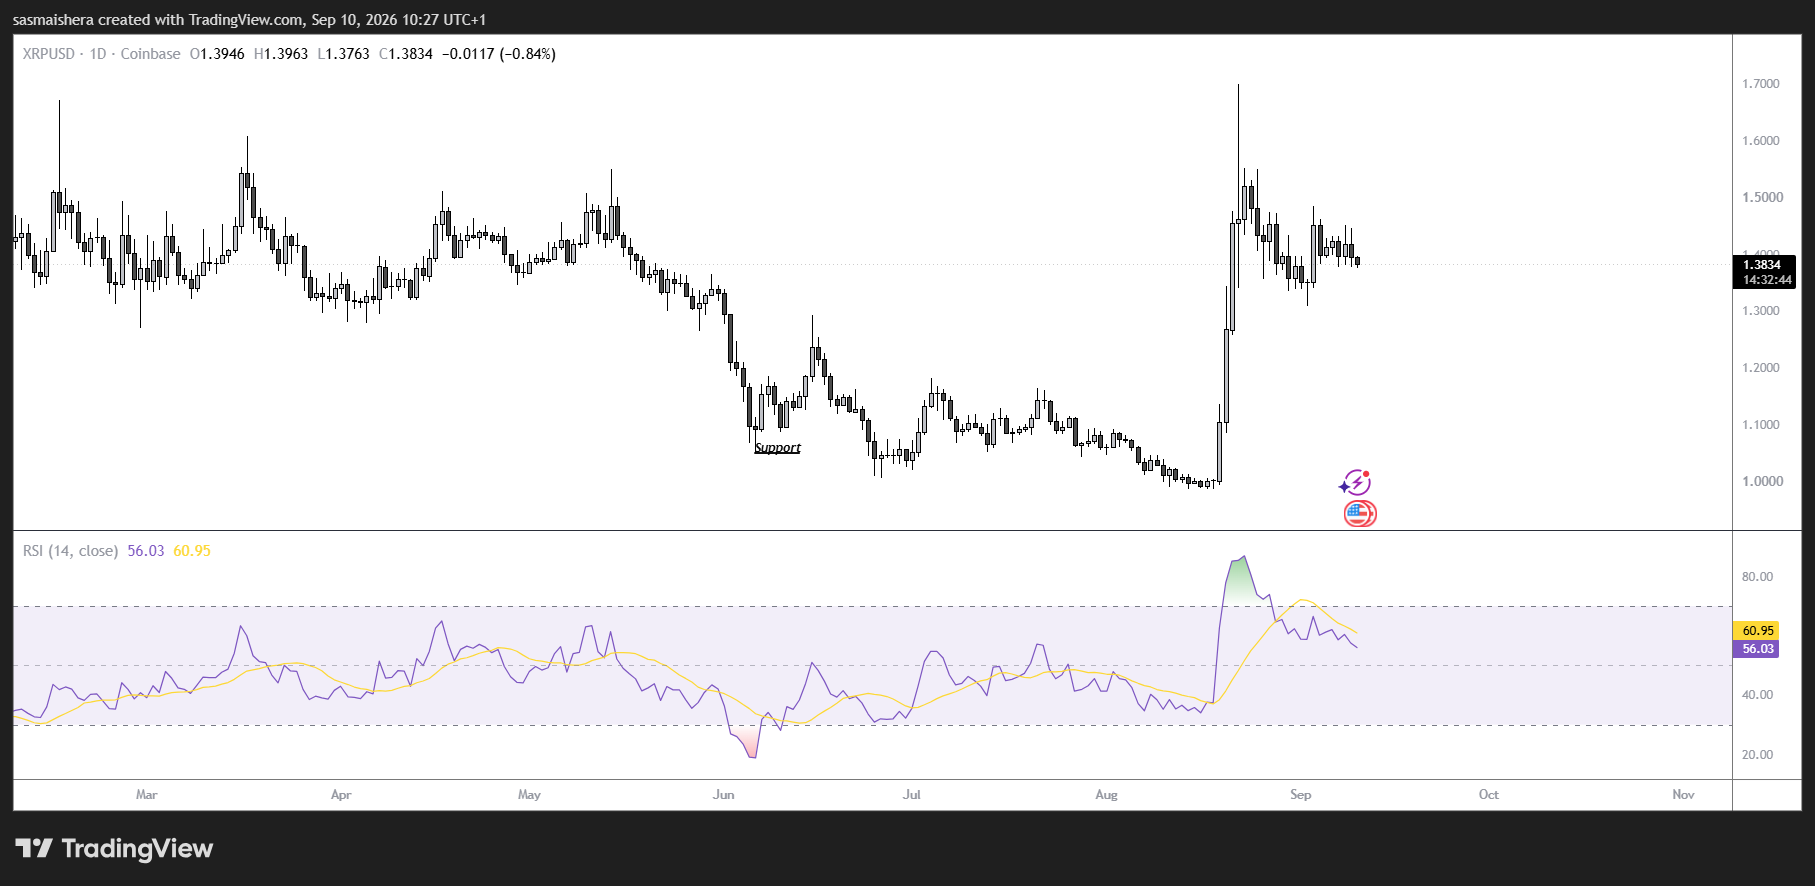
Relatively speaking, the main resistance level above is around $1.900. Only if the daily chart manages to break above this level again could it trigger a stronger recovery trend. Before that, weakening demand for derivatives and a decline in momentum may still put XRP under pressure in the area supported by the moving averages.