In July, Australia's Consumer Price Index (CPI) rose by 3.5% year-on-year, lower than the 3.8% in June. Just looking at this headline figure, it seems that inflation is continuing to move in a more moderate direction; however, the details released by the Australian Bureau of Statistics show that price pressures have not decreased uniformly. The seasonally adjusted monthly CPI increased by 0.6%, with gasoline prices soaring by 7.5% in a single month, while the trimmed mean inflation, which is used to observe the underlying trend, remained at 3.6%, unchanged from June.
There are two common misinterpretations of this set of data: one is to assume that inflation has significantly eased just by seeing the year-on-year decline; the other is to think that inflation has risen sharply again just by noticing the surge in gasoline prices. The actual situation lies somewhere in between. The year-on-year growth rate is affected by the base figure from the same period last year, and monthly data can be easily influenced by a few fluctuating items. For households and central banks, it is more important to know where the increase comes from, how long it can last, and whether it will spread to areas related to services and wages.
Energy prices suddenly rose, and housing pressures remain high.
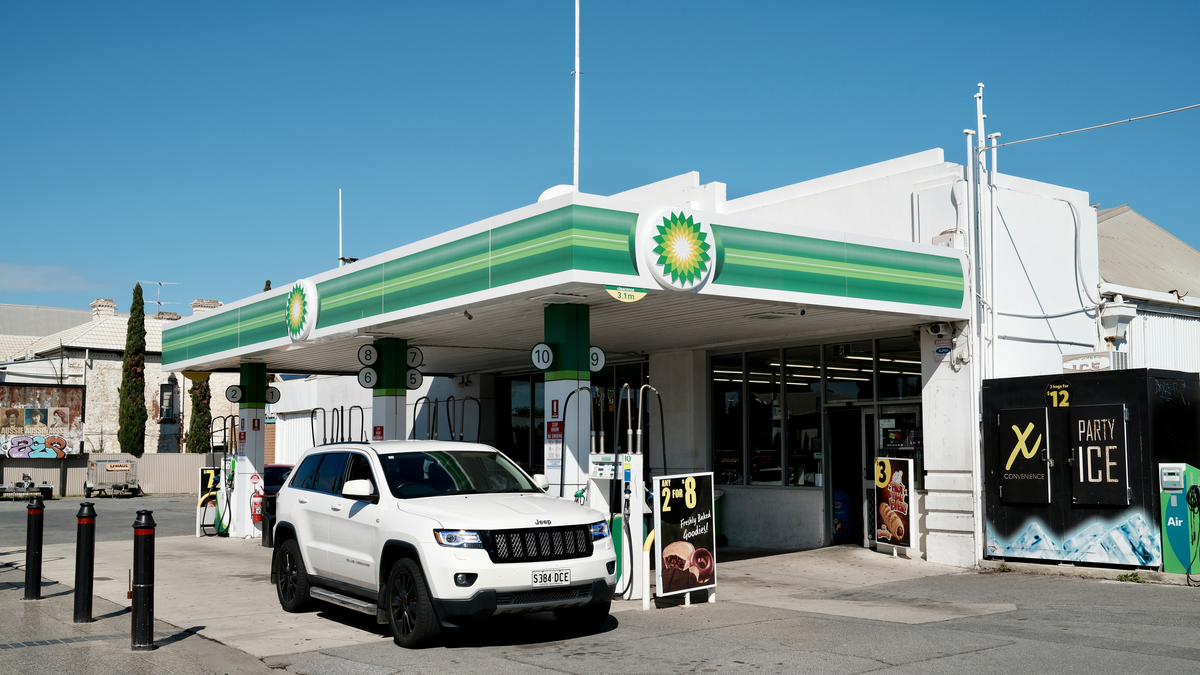
In July, automobile fuel prices rose by 7.5% month-on-month, ending a three-month consecutive decline. The Australian Bureau of Statistics linked this change to the global increase in oil prices and the partial withdrawal of fuel consumption tax reductions. Fuel is a typical example of a price that is frequently observed by consumers; they experience these changes every time they refuel, which means its impact on inflation expectations and consumer confidence is often greater than its statistical weight alone.
But the impact of fuel prices and widespread overheating of demand are not the same thing. International oil prices, exchange rates, refining arrangements, and tax policies can all cause changes in retail prices in the short term. If energy prices stabilize in the coming months, the sharp increase in July will not accumulate at the same rate; if global supply remains tight, transportation and distribution costs may be passed on to food and other goods. Policy decisions need to distinguish between one-time price spikes and persistent secondary effects.
Housing is the more slow-moving and stubborn aspect. Housing prices rose by 5.0% year-on-year, significantly higher than the overall CPI; food and non-alcoholic beverages saw a rise of 3.2%, while entertainment and culture increased by 2.6%. These items are closely related to household daily expenses, especially since housing costs cannot be avoided by making a single purchase reduction. Even if there is an overall year-on-year cooling down, tenants, new homebuyers, and families with higher energy expenses may still feel that the cost of living has not significantly eased.
From the monthly seasonally adjusted data, housing prices fell by 0.3%, while transportation prices rose by 2.4%. These opposite directions precisely illustrate why the overall index for a single month should be interpreted with caution. The raw monthly CPI figure rose by 1.0%, but after seasonal adjustment, it was 0.6%. Seasonal patterns, government subsidy timing, and the pace of price collection can all lead to discrepancies. By selecting only the data that supports a particular viewpoint, it is easy to reach overly definitive conclusions.
Base inflation has not declined, and interest rate discussions will still require confirmation over several more months.
The trimmed mean inflation rate remains at 3.6%, which is a more significant indicator in this report. The purpose of this metric is to exclude the most extreme price changes for the current month, not to ignore the actual energy and food prices paid by consumers, but to observe whether price increases are continuing on a broader scale. Although the overall CPI has decreased, the trimmed mean remains unchanged, indicating that the improvement in the headline figures has not yet fully translated into a relief of underlying pressures.
Starting from October 2025, Australia will begin releasing complete monthly CPI data, and the market is still adapting to this more frequent dataset compared to the previous quarterly indicators. Monthly statistics can capture turning points more quickly, but they also bring in more noise (uncertain or irrelevant information). The Australian Bureau of Statistics plans to update the weightings in January 2027; until then, there may be a lag between changes in the consumption structure and the existing data set. For policymakers, trends over several consecutive months are usually more reliable than a single release.
Therefore, the interest rate path will not be determined by a single figure of 3.5%. Central banks need to assess service prices, rents, wages, productivity, and the labor market simultaneously. If the rise in fuel costs is only a temporary shock, and housing and service inflation gradually slows down, overall inflation may continue to decline; however, if energy cost transmission, wage growth, and demand remain strong, it may be more difficult for underlying inflation to return to the target range.
The environment faced by businesses is equally complex. Rising transportation costs will squeeze the profits of industries such as retail, logistics, and aviation, but whether prices will increase depends on the level of competition and consumers' affordability. Families may offset fuel expenses by reducing non-essential consumption, which can lead to a substitution effect between energy inflation and other demands. The "increases" seen in macroeconomic data do not mean that all prices move in the same direction at the same time.
The July report can be summarized as follows: Year-on-year inflation did indeed fall from 3.8% to 3.5%, but the decline was not uniform, and there is no confirmation that the trailing average will continue to drop further. The 7.5% increase in gasoline prices in a single month is the most notable disruption, while year-on-year housing price increases of 5.0% represent a more persistent source of pressure. In the coming months, the market will only see more solid evidence of inflation improvement if monthly growth rates decline, underlying inflation slows down, and housing prices stabilize. Until then, these data points seem more like a complex transitional phase rather than a sign that the task of reducing inflation has been successfully completed.
The next set of data should also be considered in conjunction with retail sales and household surveys. If households simply shift more of their budget to fuel while cutting back on other expenses, total demand may not increase accordingly; if multiple service items continue to see price hikes, it indicates that the pressure is spreading. Distinguishing between these two scenarios is the real value that high-frequency CPI can add to policy discussions.