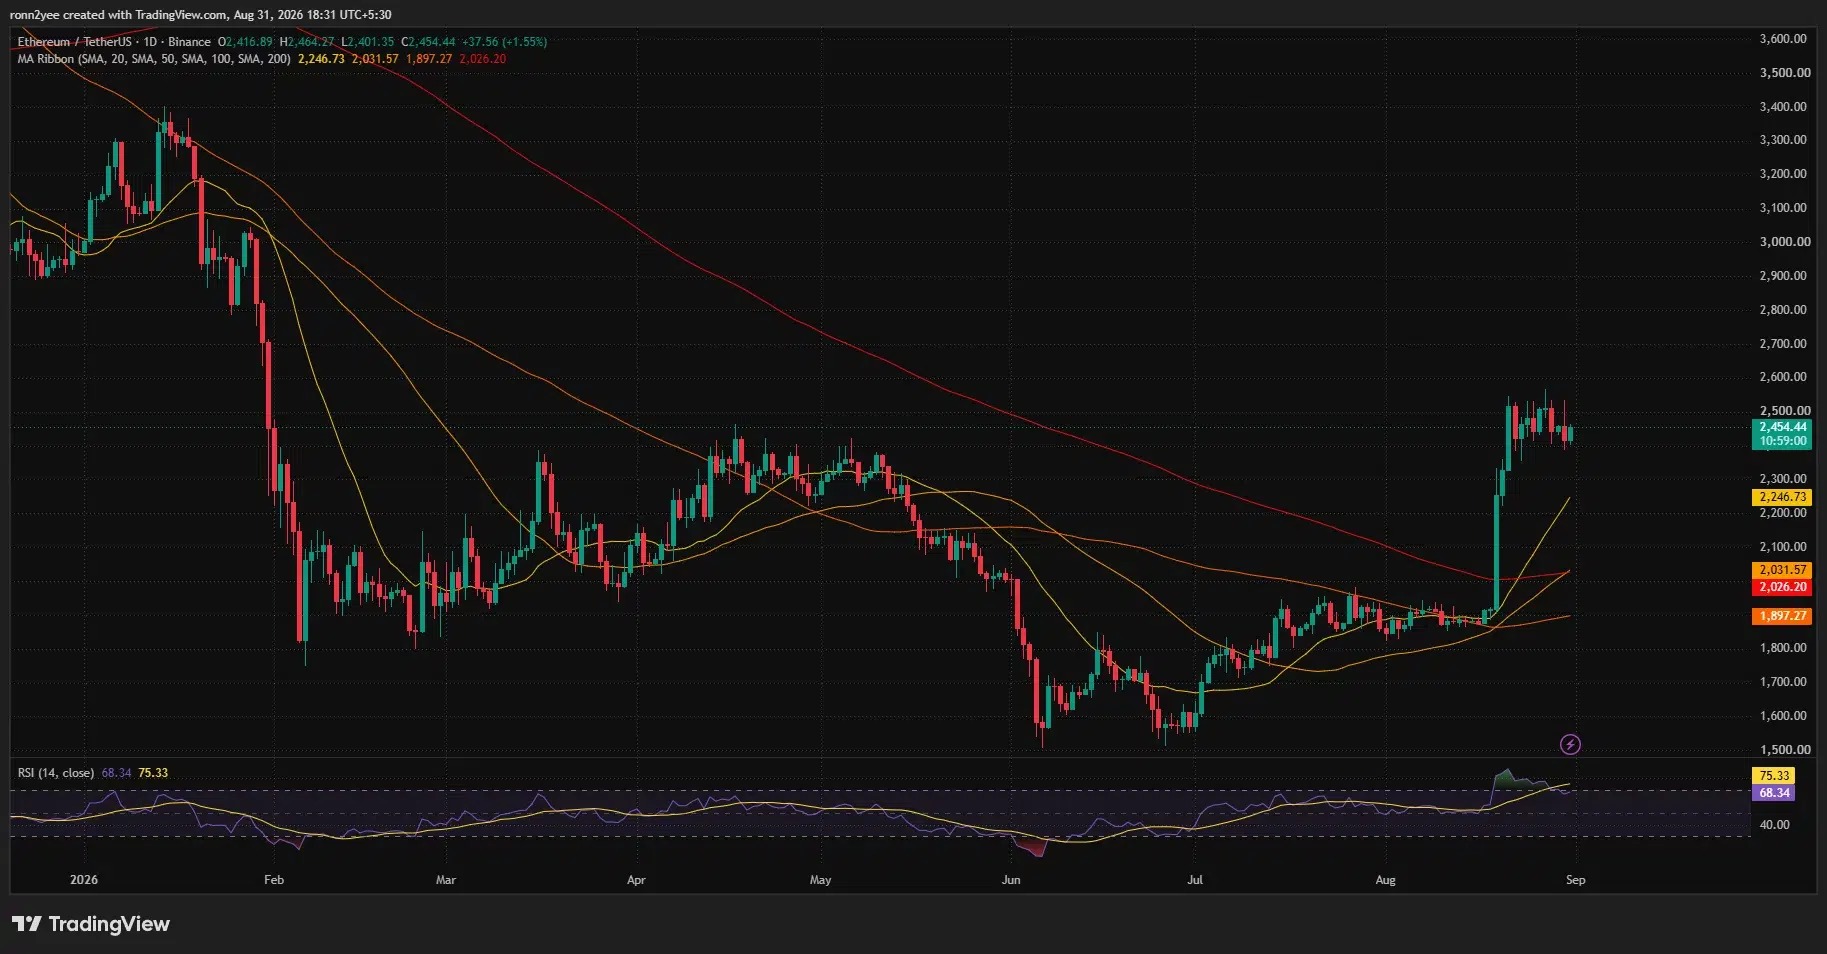


At the end of August, Ethereum failed to hold above $2,500, and prices returned to a range consolidation phase. Although there was still a cumulative increase of about 28% over the past 30 days, short-term buying attempts near $2,550 were repeatedly thwarted. Market attention has now shifted back to whether the level of $2,400 can be held.
Resisted several times around $2,550
As of August 31, ETH traded around $2,455, a slight decline from the opening price of this week. Previously, the price rose to $2,564, but then faced selling pressure and failed to achieve a valid breakthrough.
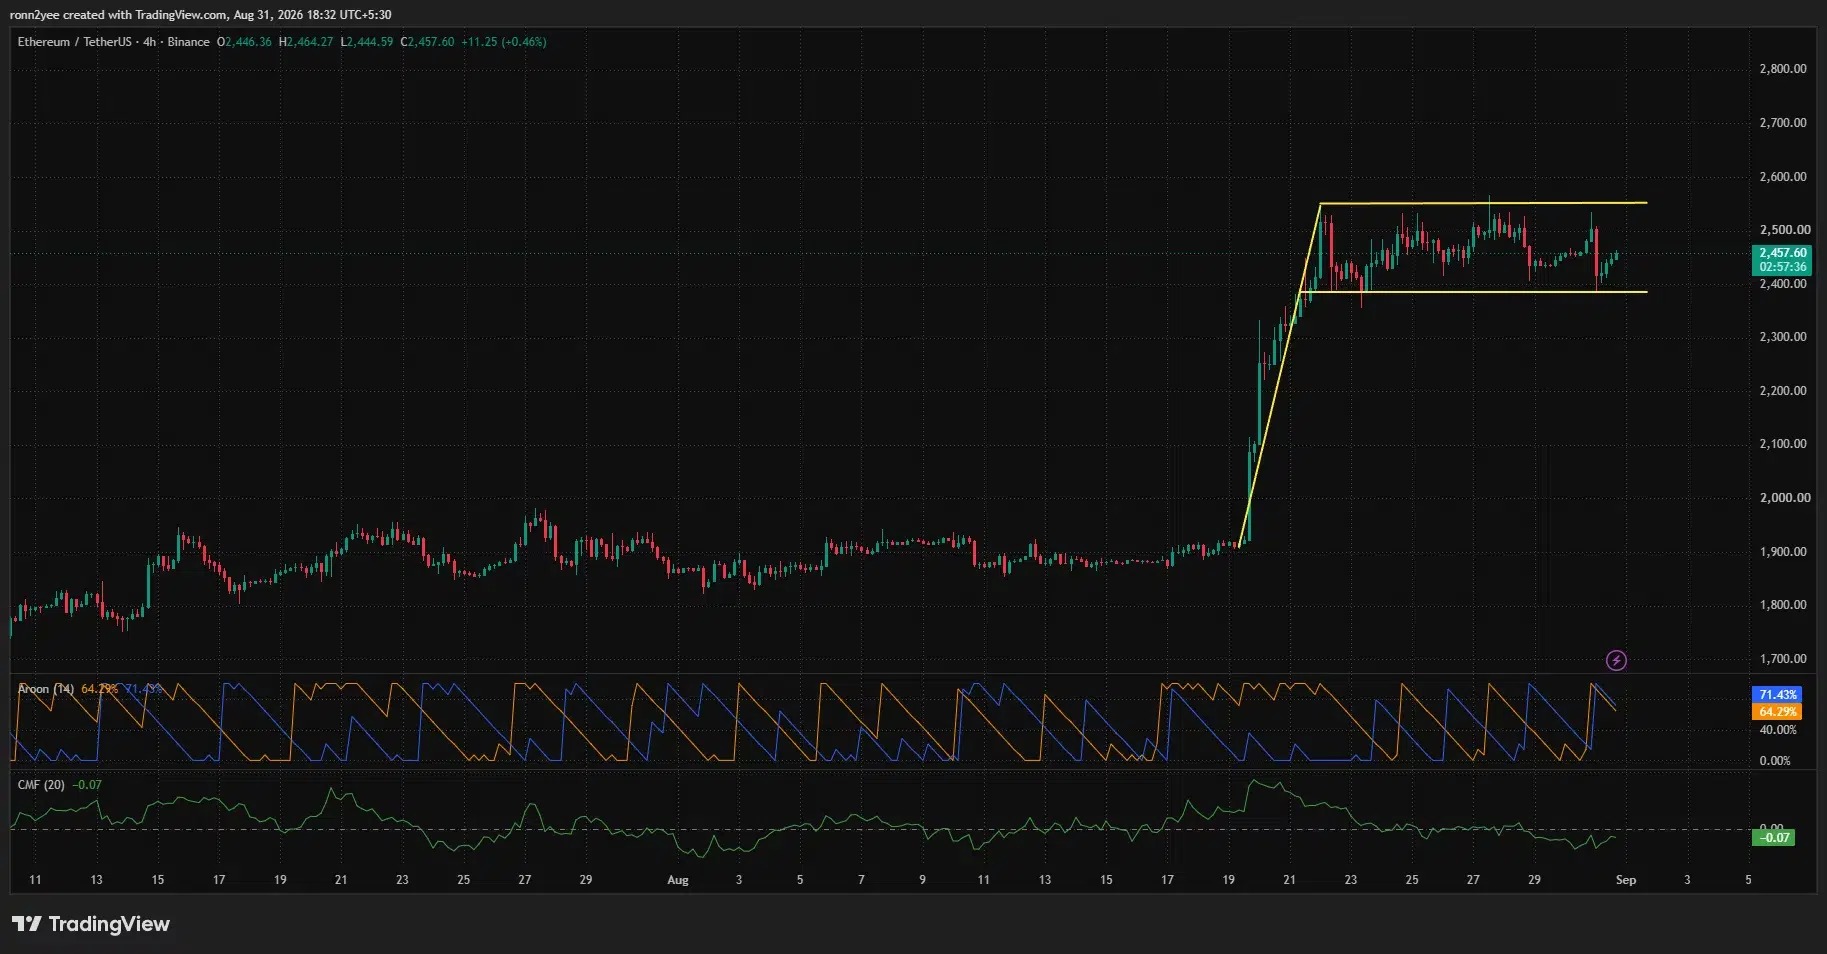
From a daily chart perspective, ETH broke through several medium to long-term moving averages in the range of $1900 to $2050 in the mid-to-late part of August and then rose rapidly, with a gain of over 30% within just a few trading days. However, recently the price has been fluctuating mainly between $2390 and $2550, with multiple attempts to rise higher only to fall back, indicating that there is still significant selling pressure around $2550.
$2,400 marks a short-term dividing line
On the daily chart, RSI has fallen from a level above 70 to 68.34, indicating that the momentum from the upward movement in August is beginning to cool down, but it has not yet completely weakened. Meanwhile, ETH remains above the main moving averages, with the 20-day moving average at around $2246.73, which will become the first important support level if this current range is broken below.
On the 4-hour chart, ETH is still within a sideways range. Short-term indicators show that the market has not yet formed a clear one-way trend. However, after the most recent attempt to rise failed, bears have a slight advantage. The capital flow indicator is also close to neutral but weak, indicating that there is selling pressure, but it has not yet become a dominant force.
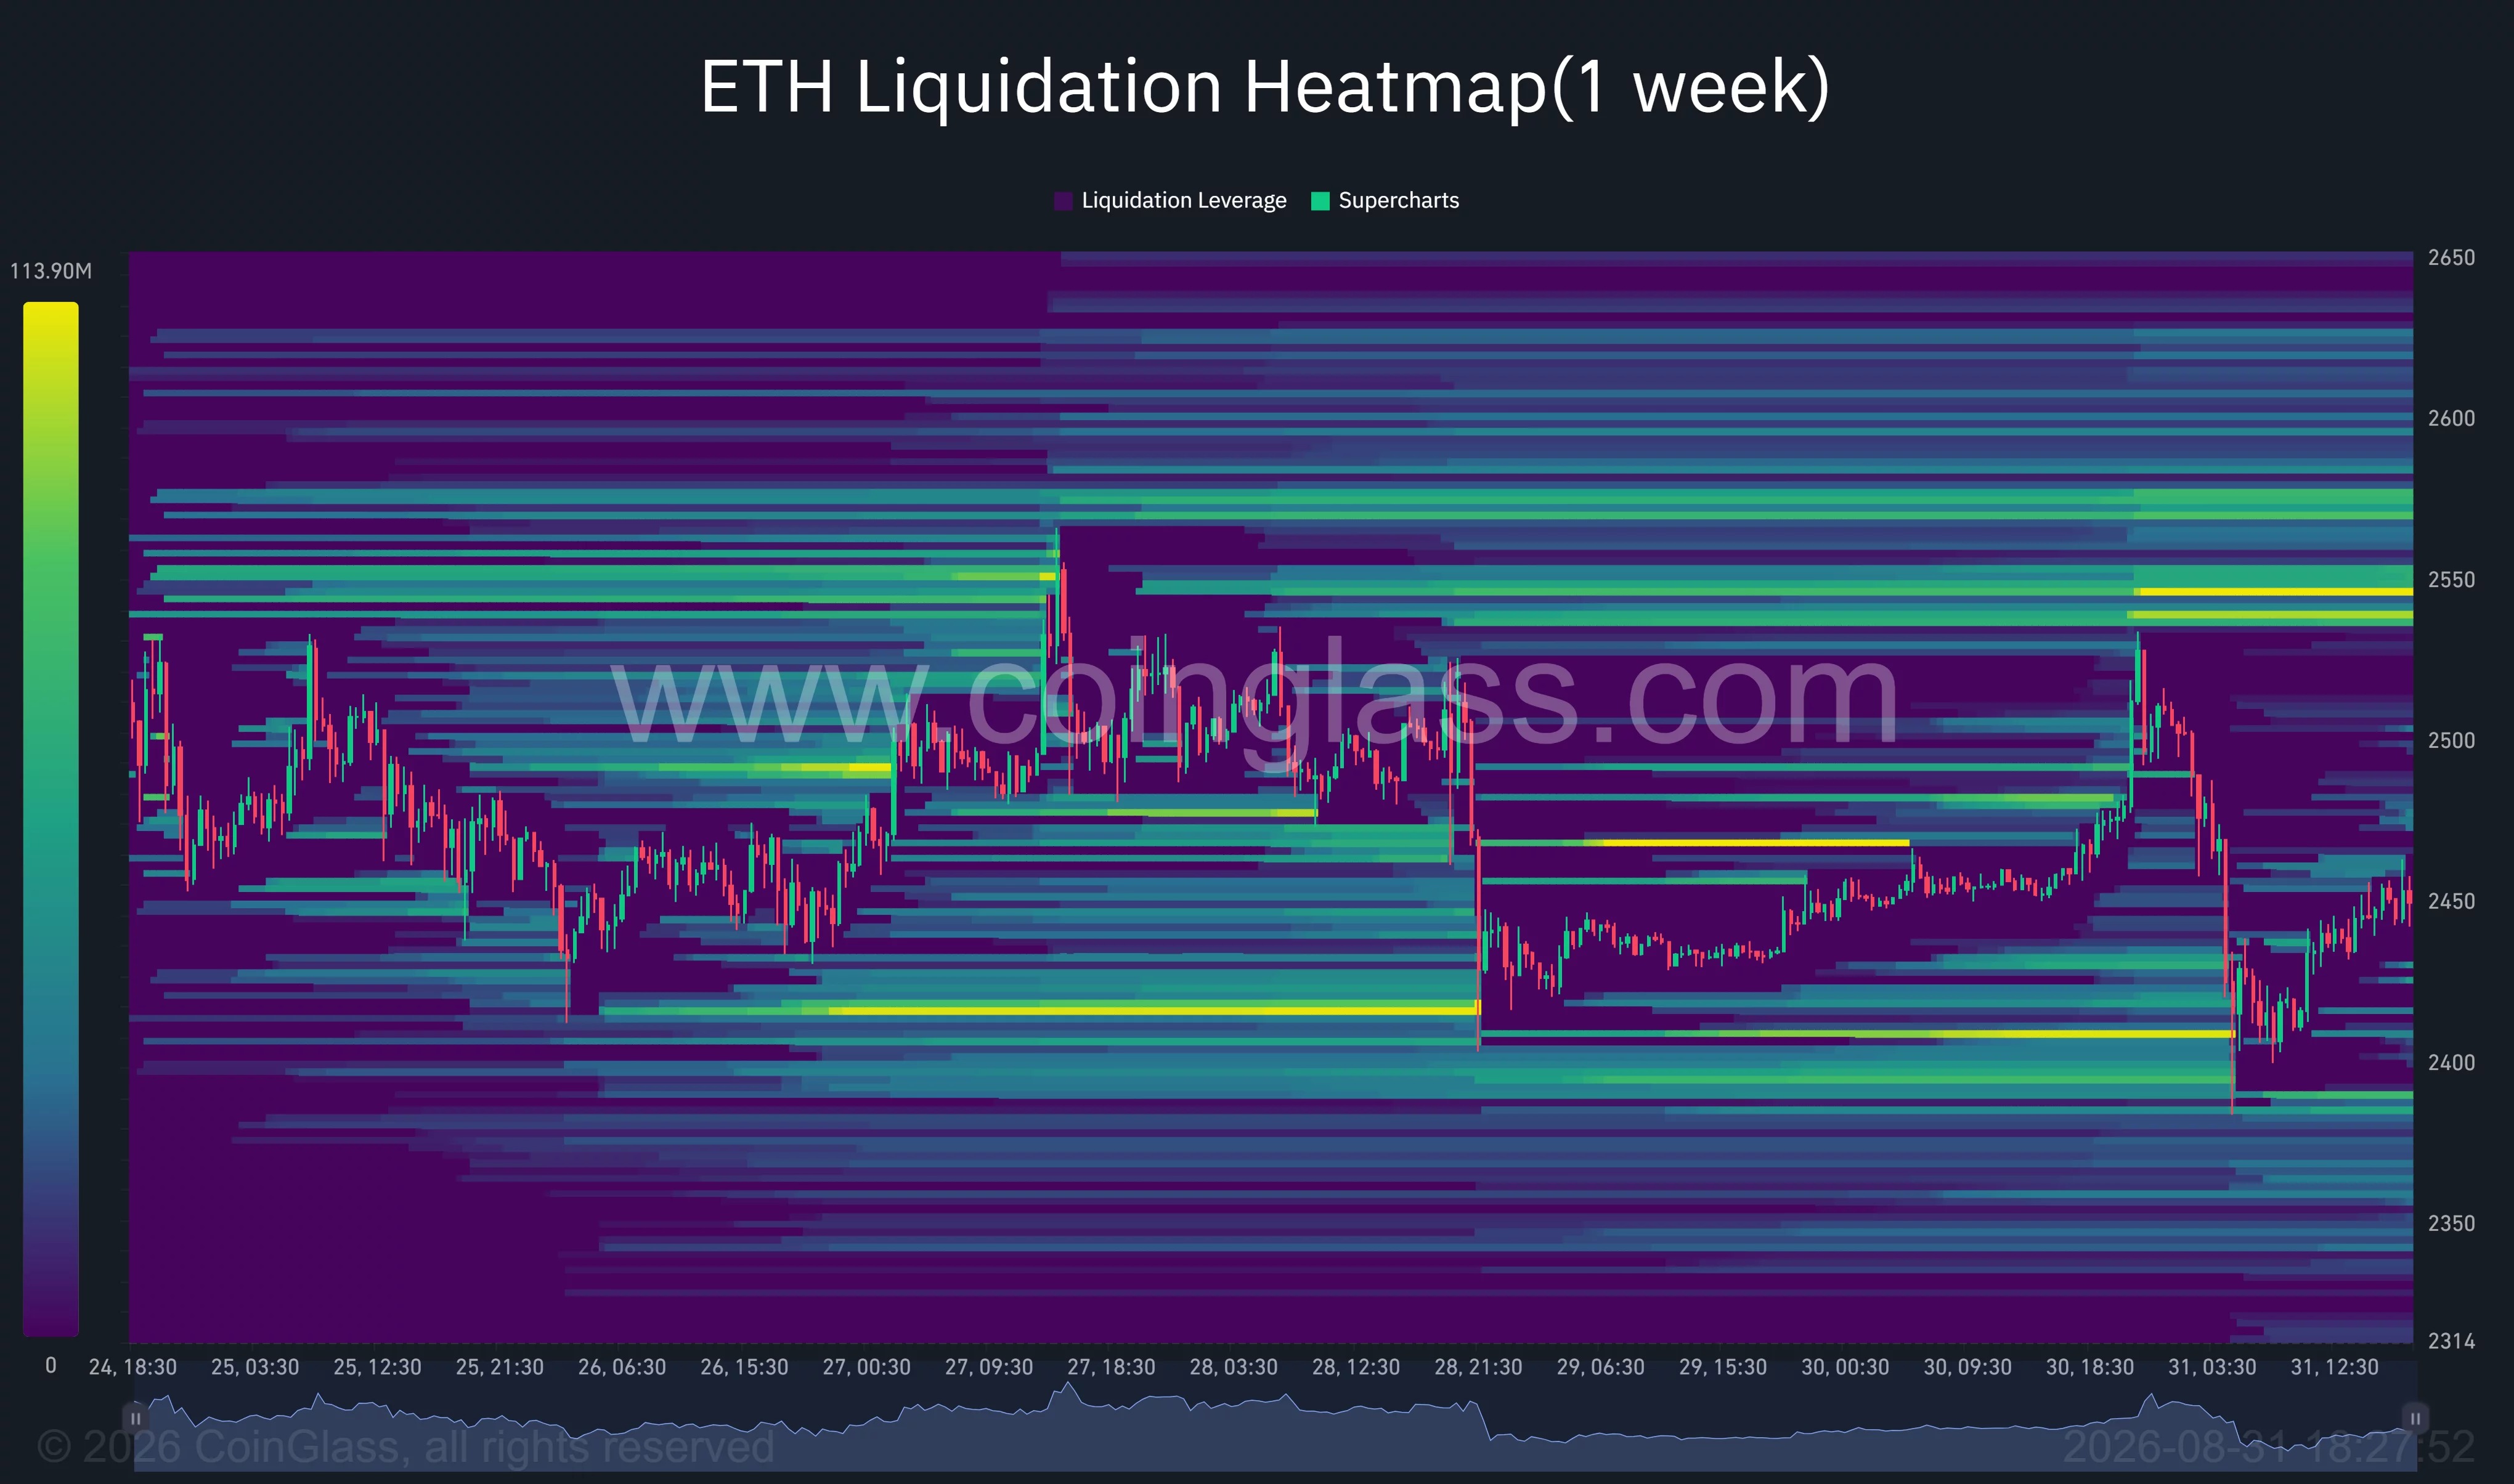
The clearing range is concentrated between $2,390 and $2,575.
CoinGlass The weekly clearing heat map shows that there are a significant number of leveraged positions concentrated around the $2,545 to $2,550 range, and there is another area with high liquidity in the $2,570 to $2,580 range. If prices rise back to these levels again, it could trigger short covering, but it might also attract additional selling pressure.
In the areas below, there are also relatively clear clearing concentration zones around $2410 and $2390. If ETH falls below $2400, some leveraged long positions may be forced to close, which could lead to increased short-term volatility.
- The first breakout level above is at $2,550.
- The short-term support level below is at $2,400.
- The 20-day moving average support is around $2,247.
Some analysts believe that if ETH cannot break through $2,550, the price may continue to fluctuate within a range, with a deeper support level around $2,250. If this area is also lost later on, the 50-day and 200-day moving average areas around $2,030 could become the next major support levels.
ETF Funds are still flowing in.
In terms of institutional funds, US spot Ethereum ETF continues to see inflows. Farside Investors aggregate data shows that over the five trading days from August 24th to 28th, there was a total net inflow of $815.7 million into US spot Ethereum ETF. Among these, BlackRock ETHA absorbed $567 million, with a single-day net inflow on August 27th reaching a high of $225.8 million for that week.
Overall, the monthly rebound structure of ETH has not been disrupted, but the short-term momentum has slowed down. Moving forward, the market will be more focused on two directions: one is whether the buying pressure can once again push prices above $2500 and break through $2550, and the other is whether the support level at $2400 and the underlying liquidation zone will be breached.