

Foreign media believes that after breaking through the resistance zone that had persisted for several months, SOL has remained above $100, with prices once rising to around $111. After falling back to the $102 range, the market is observing whether this previous resistance level can turn into new support, which will determine whether this upward trend can continue.
The article mentioned that SOL recorded its first monthly increase in nearly 10 months in August, which helped to repair market sentiment. At the same time, the high level of decentralized trading activity on the Solana chain also served as an important factor supporting its price performance.
Solana On-chain transactions remain active
Coinpedia mentioned in the text that the trading volume of DEX within the Solana ecosystem has consistently been among the top in the crypto market. Calculated on a weekly basis for spot trading volume, the relevant platform has ranked second for 9 consecutive weeks, only behind Binance. This indicates that spot trading and liquidity on the Solana chain are still relatively concentrated.
The article also mentions that the market's focus on Solana is shifting from mere price fluctuations to the actual economic activities within the network. As the on-chain usage rate, trading volume, and liquidity remain high, investors are beginning to place more emphasis on the income and activity level that the ecosystem itself brings.
The range of $100 to $103 constitutes a short-term observation zone.
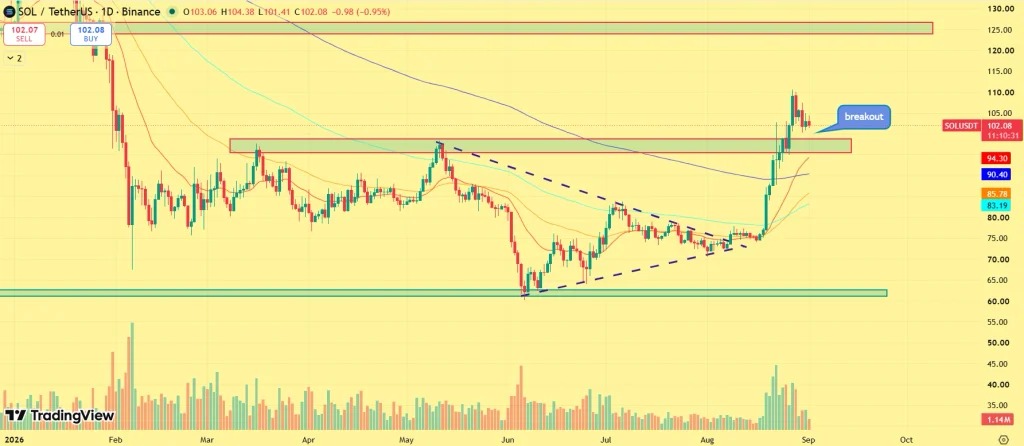
From a price structure perspective, the area around $102 to $103 is currently a retraction zone following this round of breakout. The article argues that as long as SOL remains above $100 to $103, the current trend is still considered strong. Since this region was previously a resistance zone, if it can turn into support, it would indicate a further improvement in the market structure.
In the aforementioned area, $105 is considered the first threshold that needs to be re-crossed, followed by the range of $110 to $112 that was previously reached. If the daily chart effectively crosses above $112, market expectations for subsequent increases to $115 or even $120 could further rise.
- Critical defense zone: $100 to $103
- Near-term resistance levels: $105, $110 to $112
- Higher resistance zones: $120, $125 to $130
A loss of 100 dollars will weaken the breakout structure.
However, this judgment is not without its premises. The article points out that if SOL continues to fall below $100, the current breakout pattern will be weakened, and prices may return to the previous consolidation range, potentially dropping to the $94 to $90 area.
Overall, this review article suggests that SOL is currently in a verification phase following its breakthrough. If the price can hold between $100 and $103 and continue to break through $112, $120 will become a more definitive technical target from a psychological standpoint; conversely, if the key support level is lost, the short-term strong structure may be disrupted.