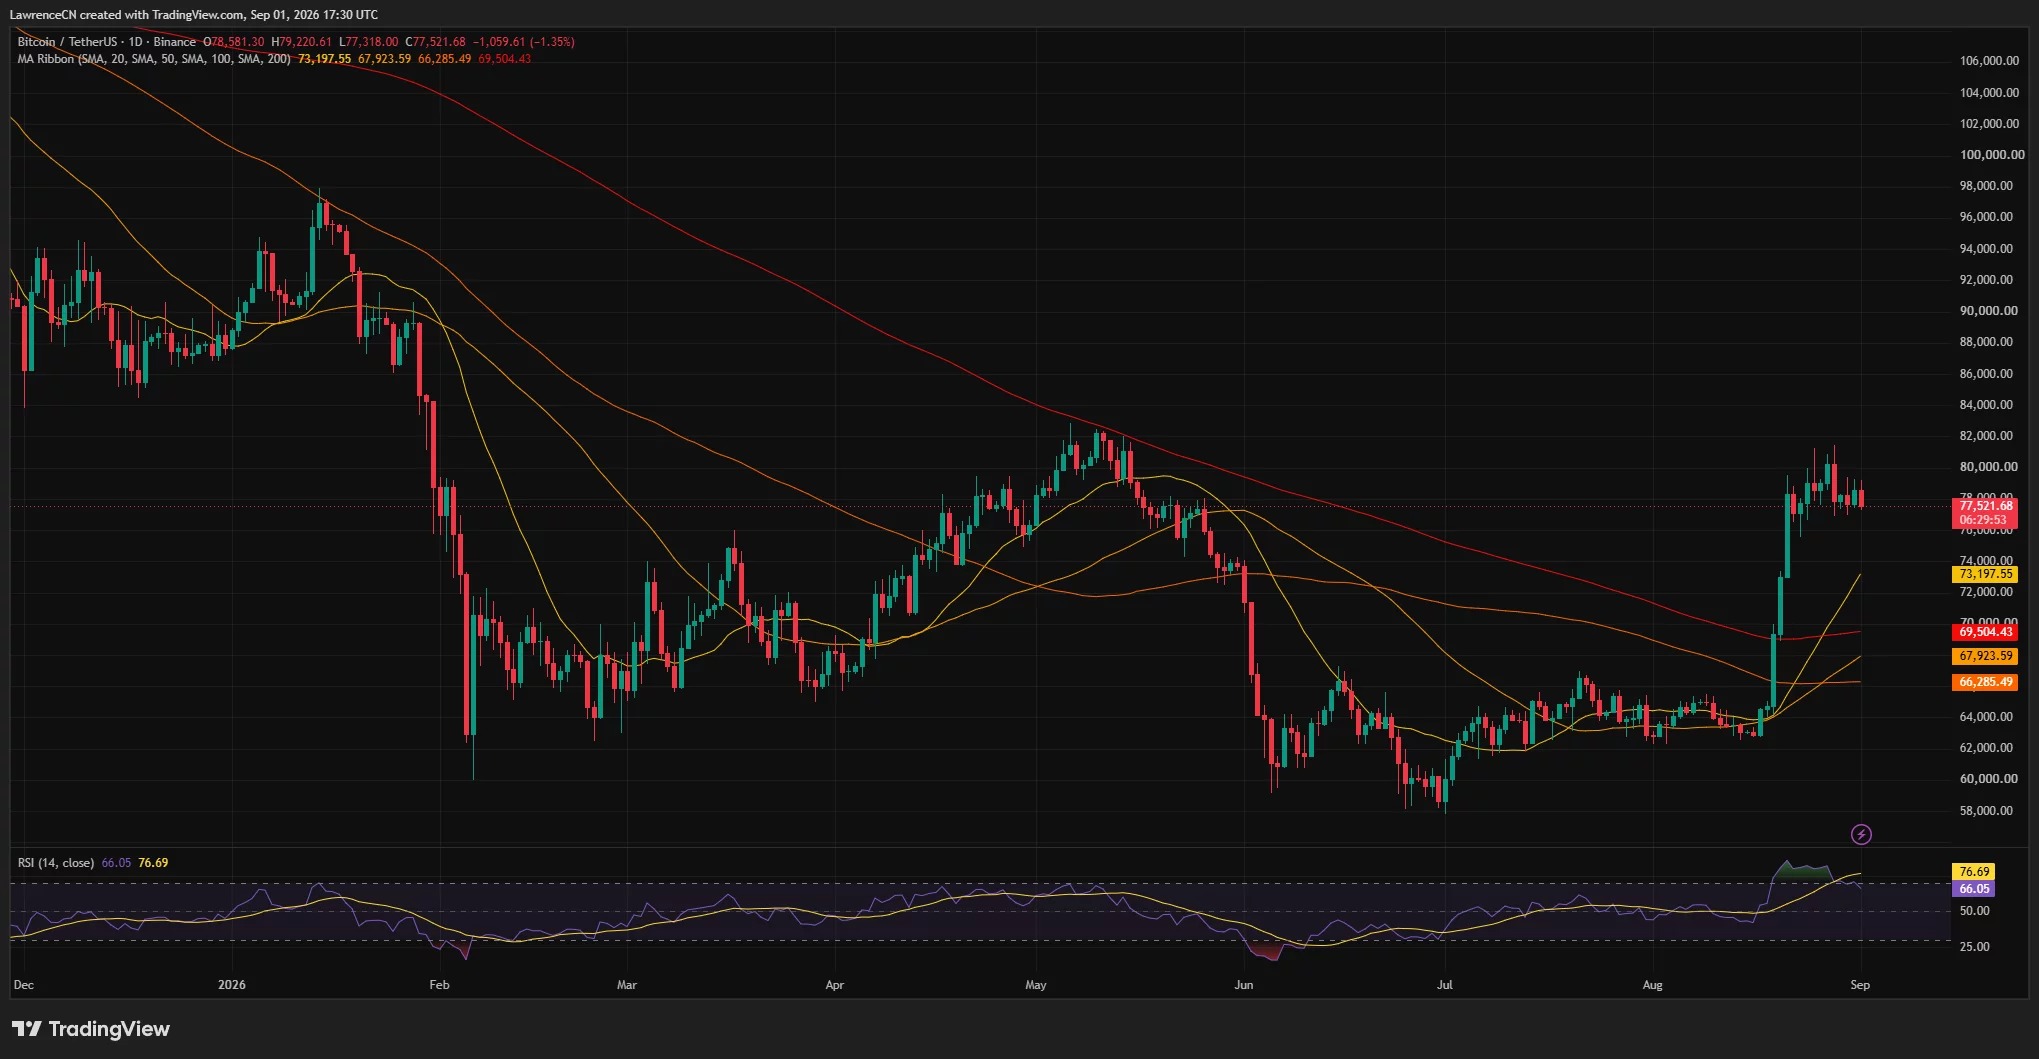


On September 1st, Bitcoin fell back to around $77,500, briefly dropping below $79,200 during the day. The net inflow of spot Bitcoin in the United States ETF continued, but rising oil prices, higher yields on U.S. Treasury bonds, and concerns about the Federal Reserve's policy path temporarily overshadowed the support provided by institutional buying.
ETF inflows failed to reverse the decline
As of press time, Bitcoin has fallen by about 1.6% in 24 hours, hitting a low of $77,318 during the session. It has fallen below the short-term support range of $77,700 to $78,000 and has also retreated by about 4.6% from its previous peak of around $81,280.
Farside Investors Data shows that US spot Bitcoin ETF had a total net inflow of $216.7 million in the most recent full trading day. Among them, BlackRock IBIT saw an inflow of $205.9 million, accounting for the majority. Previously, on August 28th, such products recorded a net outflow of $201.9 million.
This means that the demand for ETF still exists, but at this stage, the market is more influenced by external macroeconomic factors, and the inflow of funds is not yet sufficient to completely offset the selling pressure.
Oil prices and yield rates suppress risk appetite
This round of decline occurred as global markets were under pressure. Brent crude oil rose by about 2% to $92.04 per barrel. Reports mentioned that the conflict between the United States and Iran escalated again, sparking concerns about supply disruptions in the market.
Rising oil prices typically increase transportation and production costs, which in turn drive up inflation expectations. If inflation remains high, the Federal Reserve's room for interest rate cuts may narrow, and could even reignite concerns in the market about a tighter monetary environment.
At the same time, the decline in global bond markets has pushed up government bond yields. Rising yields increase the attractiveness of fixed-income assets, putting pressure on risk assets such as Bitcoin, which do not generate fixed income.
Short-term support looks at the $76,500 level.
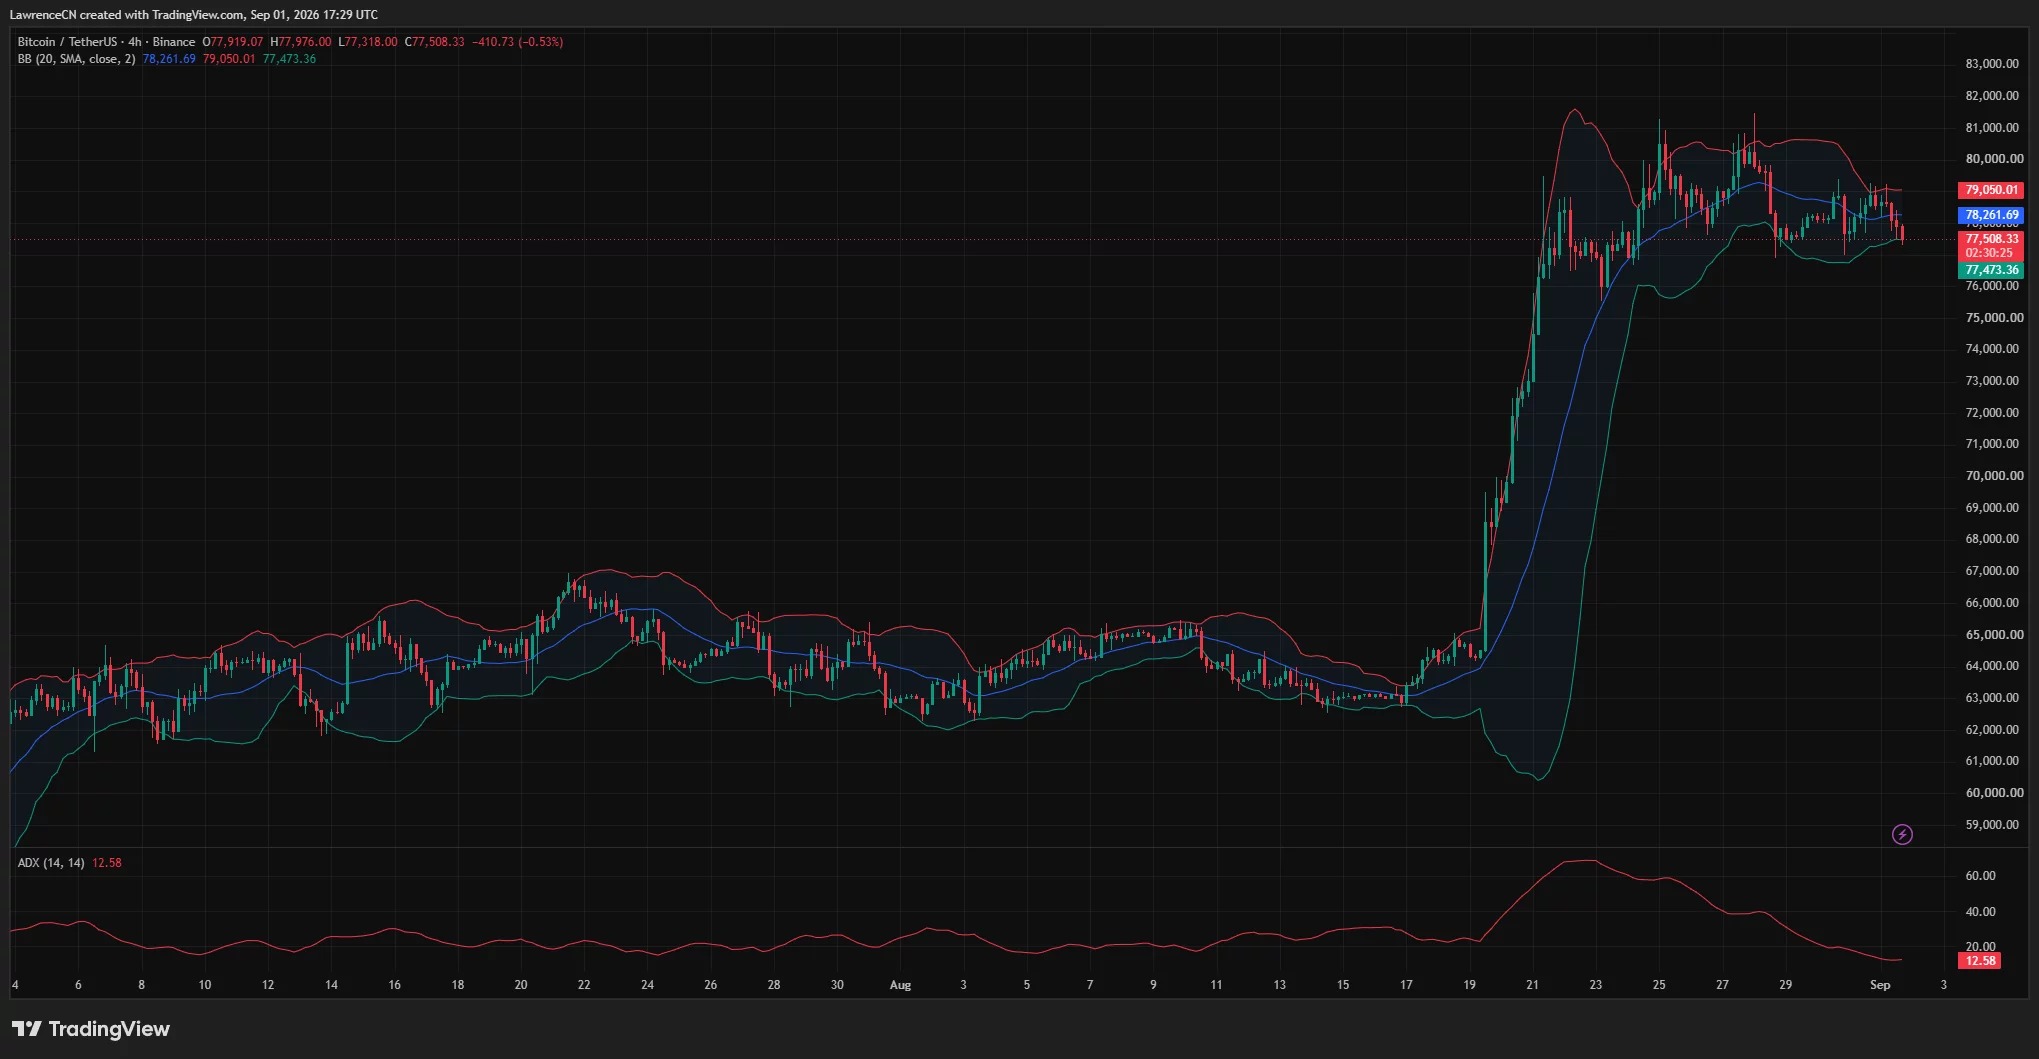
From short-term data, the 4-hour chart of Bitcoin has approached the lower band of the Bollinger Bands, with the lower band around $77,473, the middle band around $78,262, and the upper band around $79,050. The price being close to the lower band indicates that short-term selling pressure still exists.
If the price reclaims around $78,260, there is a possibility of testing $79,050 again in the medium to short term; if the lower band is lost at the 4-hour level, the market may revisit recent lows.
The CoinGlass one-week settlement heat map shows that the main leveraged positions below the current price are concentrated between $76,500 and $77,000, with a significant amount of liquidity also accumulated around $76,000 further below. Above that, the positions are mainly concentrated at $79,500, as well as in the range of $80,000 to $82,000.
Derivative data does not yet show large-scale passive deleveraging. The amount of liquidations related to Bitcoin is approximately 33 million US dollars, of which long positions amount to about 19.6 million US dollars and short positions about 13.4 million US dollars. There are approximately 25.3 billion US dollars in outstanding Bitcoin futures contracts, with a 24-hour increase of only 0.6% to 0.9%; the average funding rate is 0.0066% every 8 hours, which is still positive, but below the common reference rate of 0.01%.
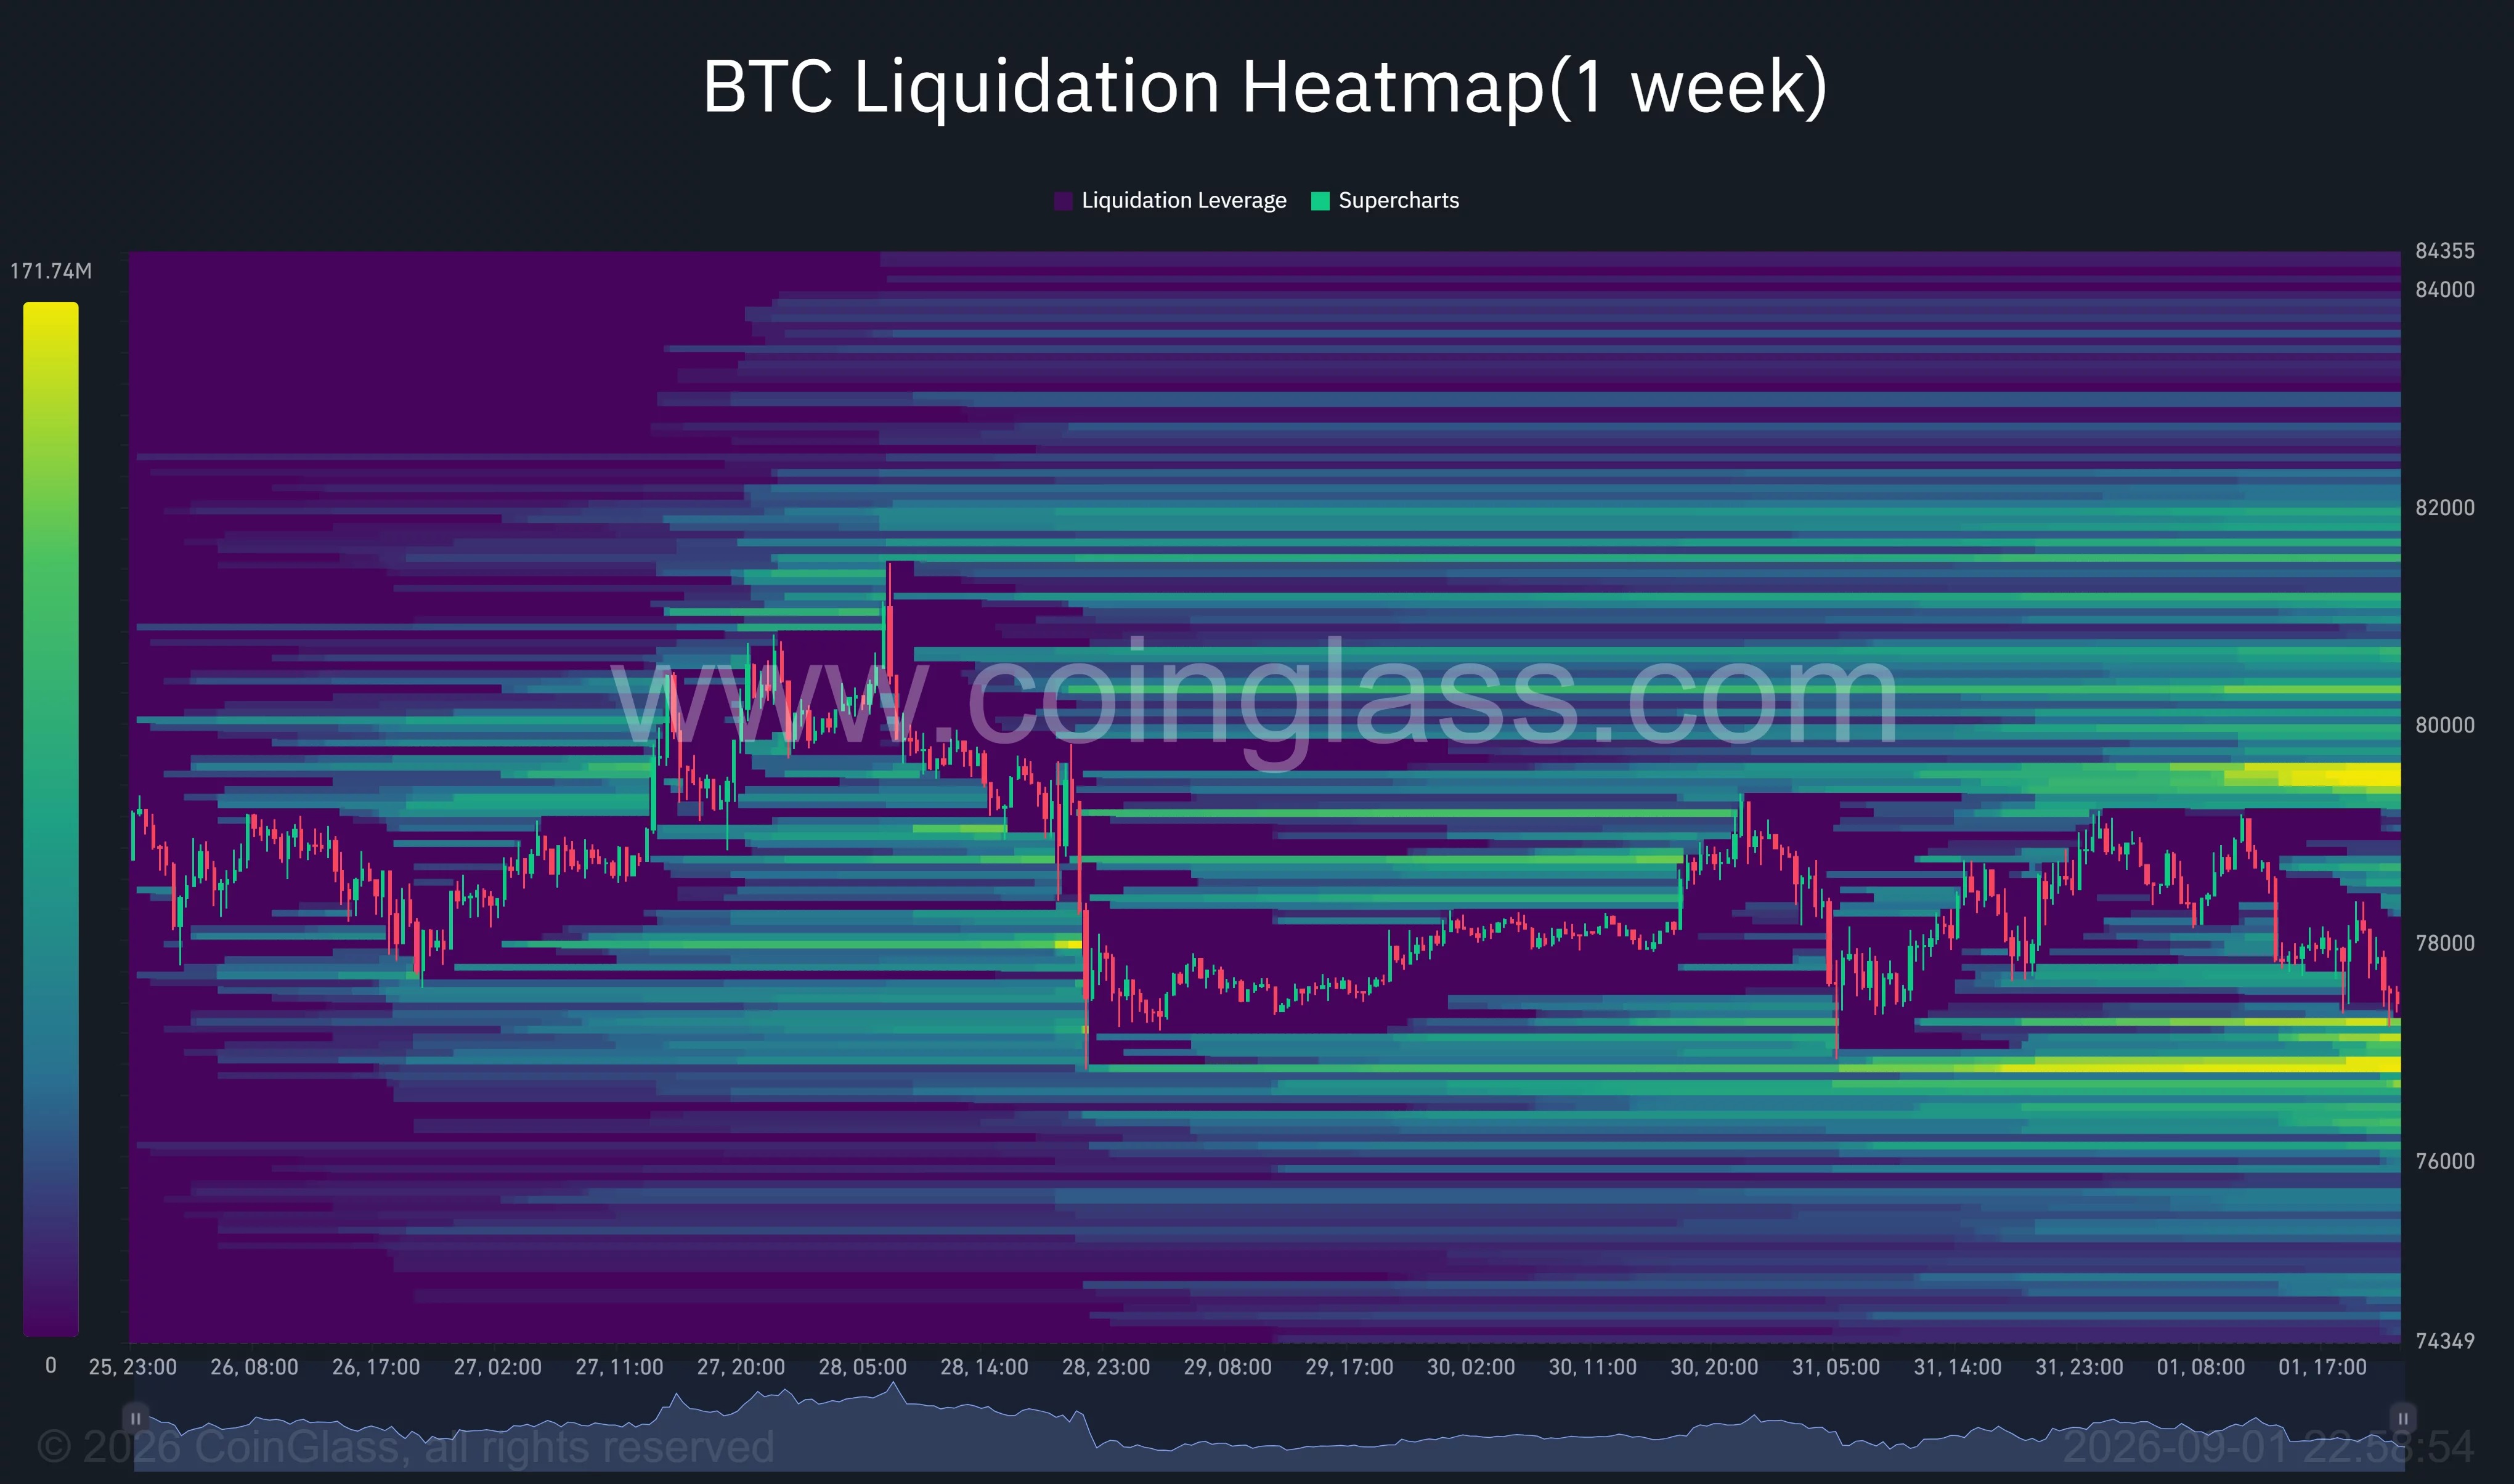
Overall, the range of $76,500 to $77,000 remains the most direct support level for Bitcoin at present. If this area is lost, prices could further decline to $75,700 to $76,000; however, if buying pressure recovers above $77,700 to $78,260 and manages to hold above $79,050, then there will be a chance for the market to test the region above $80,000 again.