

Foreign media reports that after Solana recently broke through the $103 level, market attention has shifted to two higher areas of dense trading. The report cites data from the blockchain, stating that if it can continue to hold its ground and break through $123 and $132 in the future, the supply pressure above SOL will further decrease.
New observation range appears above $103
The report mentions that SOL has recently reached $105.22, with a 24-hour increase of about 5.5%. Looking at the chart from UTXO Realized Price Distribution ( URPD ), there was approximately 39 million SOL traded around the price of $103.25, so this level is considered an important price range in recent times.
On top of that, $123 and $132 are considered to be the two main resistance levels ahead. Reports indicate that these two ranges correspond to a holding cost distribution of approximately 20 million SOL each, which means that once the price approaches these levels, potential selling pressure could increase again.
Changes in on-chain positions and supply from exchanges
In addition to price trends, the report also mentioned several positive data changes: over the past week, the number of addresses holding at least 10,000 SOL increased by 1.58%; during the same period, the inventory of SOL on the exchange decreased by 4.91%.
This usually means that some of the holdings are being transferred to self-managed wallets or decentralized staking scenarios, which could lead to a reduction in short-term tradable supply. For the market, a decrease in supply from exchanges often alleviates the pressure of immediate selling, but whether this can be sustained depends on whether there is sufficient capital to take over in the future.
- Whale addresses increased by 1.58% this week.
- Exchange SOL experiences a 4.91% decline in inventory on a weekly basis.
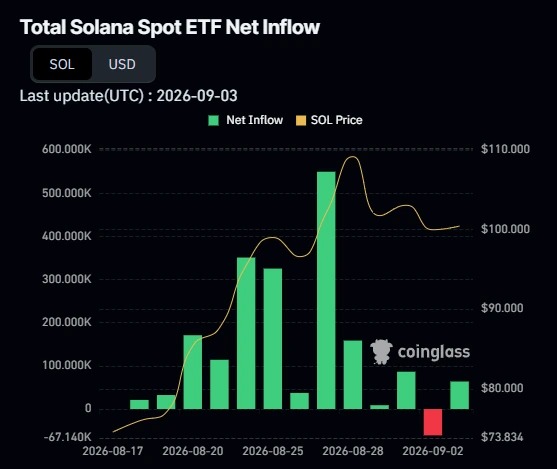
- On September 3rd, the spot ETF had positive capital flow.
ETF Synchronous improvement in cash flow and technical indicators
The report also stated that on September 3, Solana spot ETF recorded a net inflow of approximately 43,000 SOL, indicating that demand from institutional investors has warmed up compared to earlier periods. If this trend continues, it may provide additional support for prices.
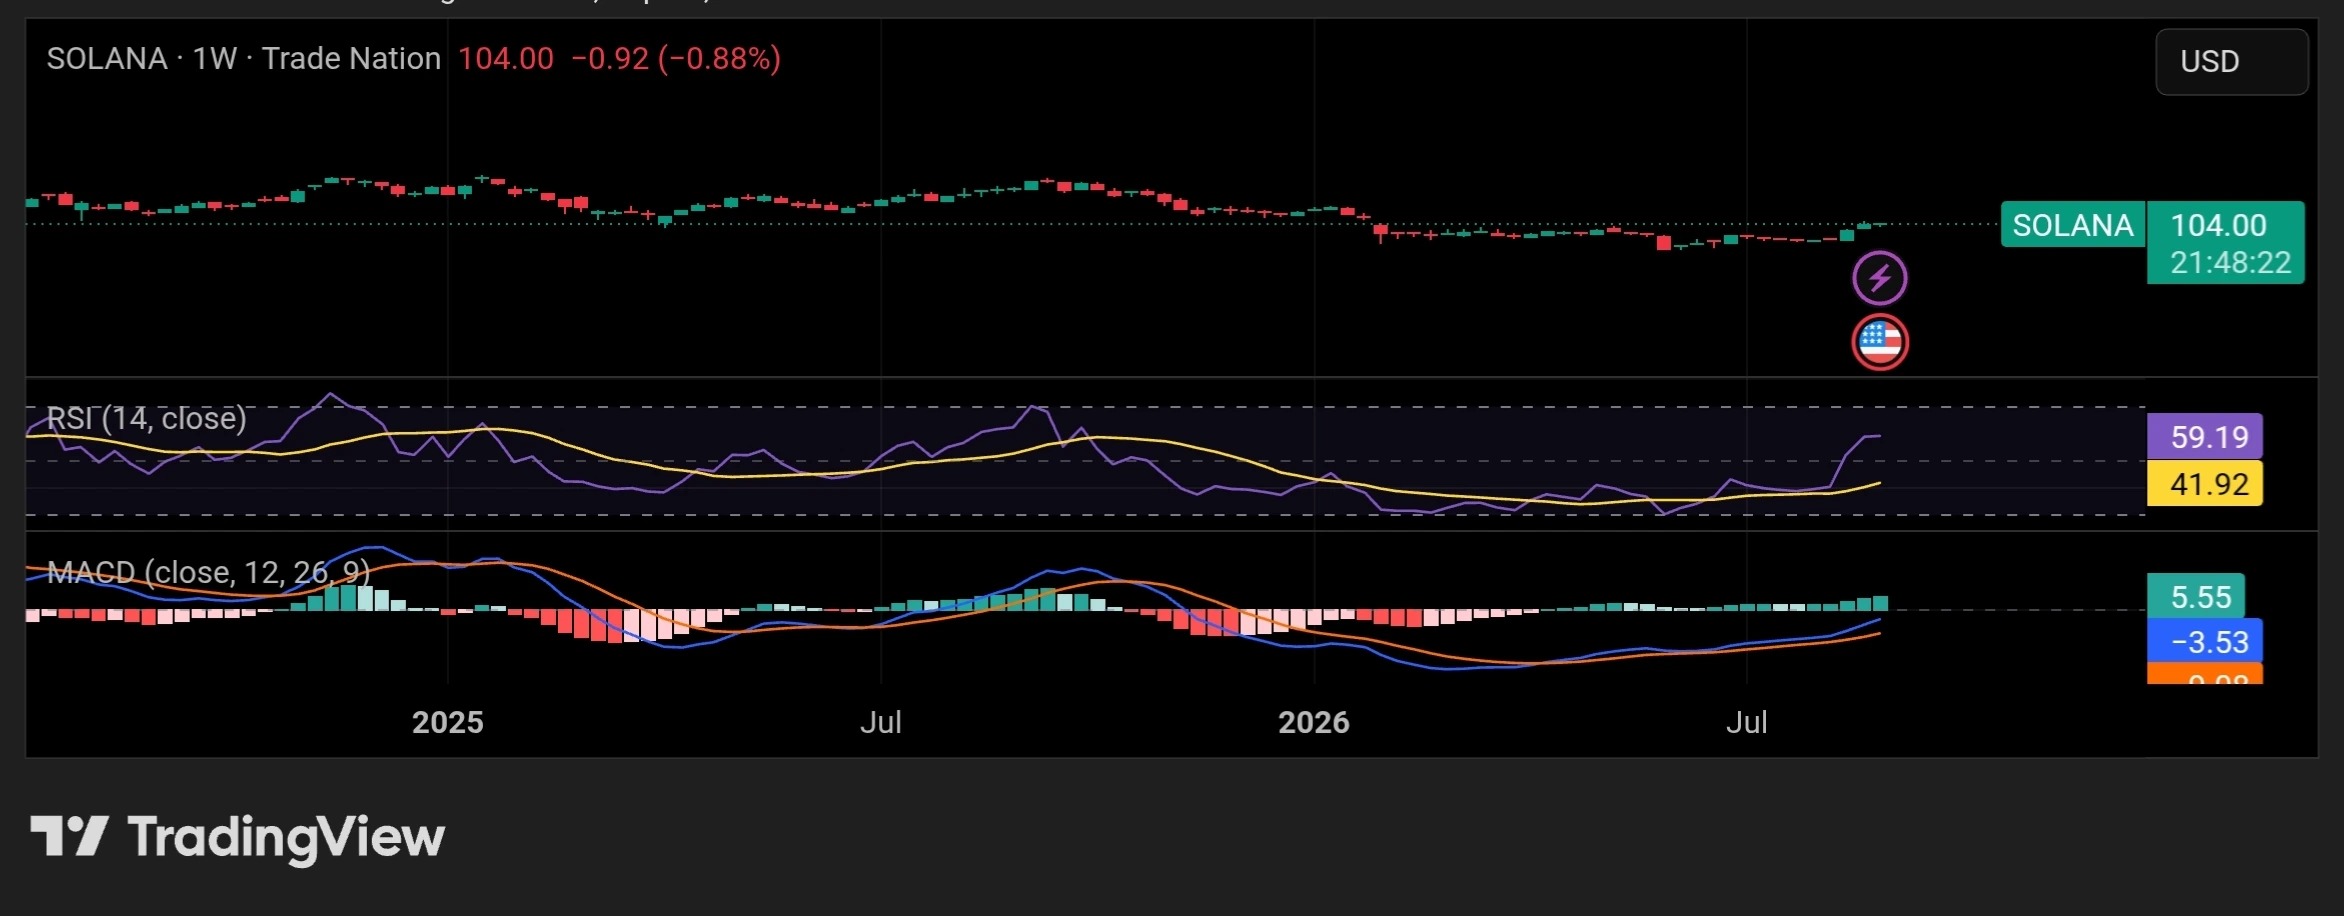
In terms of technical indicators, the text mentions that RSI is at 59.25, which is in a moderately strong range; the bar chart for MACD is above the zero axis, with a value of 5.56, indicating that the short-term momentum is still upward. Based on this, foreign media believes that if SOL subsequently breaks through the resistance levels of $123 and $132, the market will continue to regard $150 as the next important observation point.