






Foreign media reports that the stock price of Robinhood has continued to rise recently, but as it approaches its previous high, there are signs of a slowdown in short-term momentum. The article suggests that the daily chart structure remains strong, however, consolidation signals have appeared at the hourly and even shorter time frames. The performance over the next few trading days will be of greater interest.
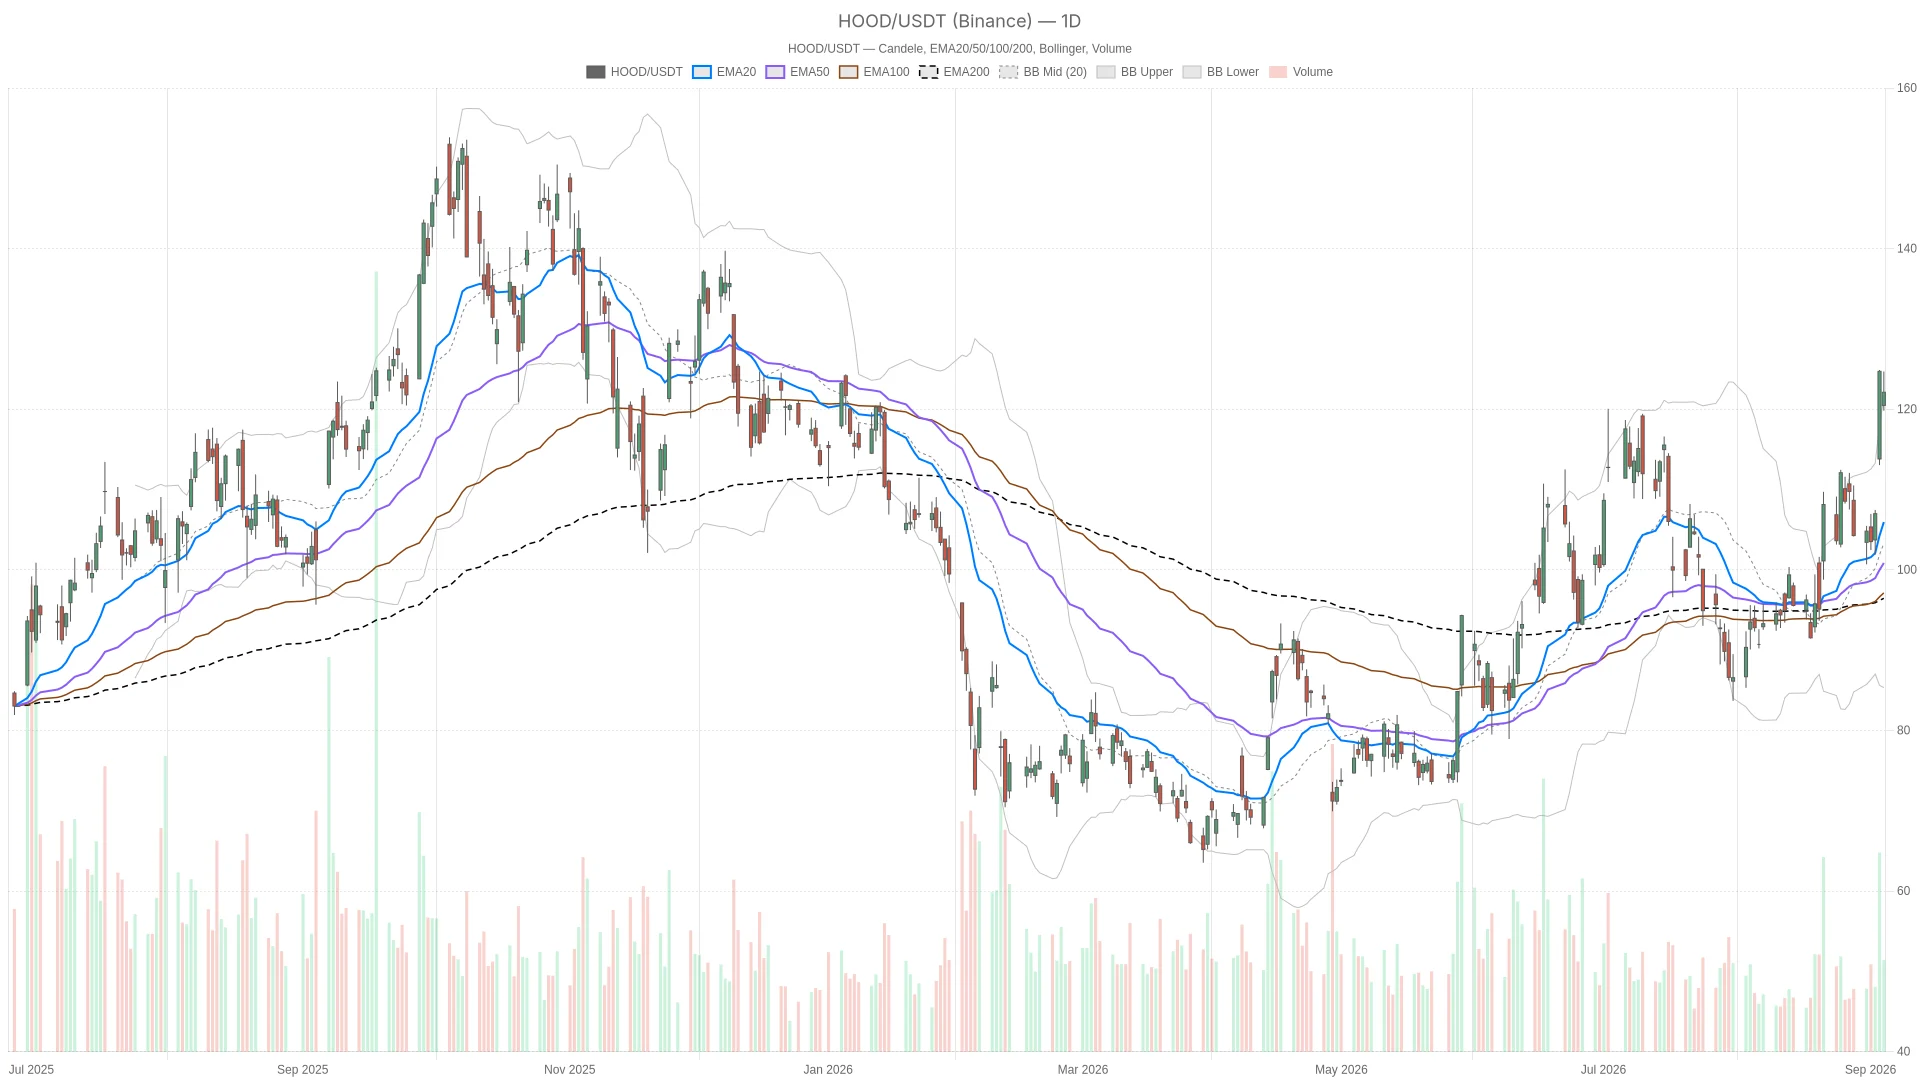
The daily chart remains strong, but it is approaching resistance levels.
As of the close on September 4th, HOOD traded at $122.11, reaching a high of $124.7 during the session, close to the resistance level of $124.6 mentioned in the text. According to foreign media analysis, the daily moving average of Robinhood remains bullish, indicating that the medium-term upward trend has not yet been disrupted.
However, the stock price is now slightly above the upper band of the daily Bollinger Bands. Based on this, the article concludes that it is becoming more difficult for the stock price to continue to rise unilaterally in the short term. It is more likely that the stock price will first digest the previous gains before deciding on the next direction. At the same time, the ATR indicator shows that volatility remains at a high level, which means that intraday fluctuations may continue to be large.
Slowdown signals appear on the hourly chart.

The article mentions that the 1-hour chart still shows a relatively strong trend, but MACD has shown slight weakening signals. The stock price is currently fluctuating around $122.34, with resistance at around $122.84 above and support at around $121.57 below, indicating that the short-term trading range has significantly narrowed.
Foreign media believes that this performance does not reflect a reversal of trend, but rather a pause after the rise. In other words, the daily chart still supports a bullish structure, but the pace of buying during the session is not as fast as in the previous phase; the market seems to be consolidating at high levels.
The focus of the news remains on blockchain business.
From a 15-minute perspective, the short-term trend of HOOD has turned neutral. The article states that RSI has returned to the middle range, and the bar chart of MACD has turned negative. The stock price is also approaching the lower edge of the short-term Bollinger Bands, indicating that buying momentum has temporarily slowed down after a surge.
In addition to chart signals, the news surrounding Robinhood is also affecting market sentiment. The article mentions that disputes regarding its tokenized stock product continue, but the company's related blockchain initiatives still attract attention, which keeps some funds tracking this stock.
Foreign media believes that if the stock price can hold its support around $119.72 and re-establish itself above the $124.6 level, the upward trend on the daily chart is expected to continue. On the contrary, if it falls below this key support level, market expectations for a pullback may increase, and at that time, the stock price could look back towards lower moving averages and the mid-range area.