


As of September 29, DOGE is trading at approximately $0.09, down 4.24% intraday, just a step away from $0.10 but repeatedly failing to hold its highs. On-chain data shows large holders accumulated over 1.14 billion DOGE within 96 hours, worth approximately $112 million. The divergence between price stagnation and accelerating whale accumulation constitutes the most noteworthy core contradiction in the current Dogecoin market.
Table: Overview of Dogecoin's Latest Key Data
| Metric | Latest Value |
|---|---|
| DOGE Current Price | ~$0.09, down 4.24% intraday |
| $0.098 Supply Wall | ~28 billion DOGE previously traded at this level |
| Next Resistance Level | Near $0.11, ~4.98 billion DOGE |
| 96-Hour Whale Accumulation | 1.14 billion DOGE, ~$112 million |
| Total Whale Holdings Change | From 54.29 billion to 55.45 billion DOGE |
| ETF Weekly Net Inflow | $2.89 million, the highest since launch |
| GDOG Holdings | ~$13.87 million, ~81% of this fund category |
| 7-Day SMA | Near $0.10 |
| Daily ATR | $0.01 |
| Top Trader Long/Short Ratio | 76.4% long, long/short ratio at 3.2 |
Note: The above content is compiled and summarized by CoinMeta based on public market data. Please refer to actual data if there are any fluctuations.
What Signal Does the $112M Whale Buying in 96 Hours Send?
Our review of Dogecoin on-chain data reveals that large holding addresses collectively accumulated over 1.14 billion DOGE in the past 96 hours, worth approximately $112 million at current prices. This accumulation occurred as the price approached the key resistance level of $0.098, rather than during a low-price panic zone. According to the cost basis distribution heatmap, approximately 28 billion DOGE were previously traded near $0.098, forming a dense supply wall; once this level is broken, the next resistance lies near $0.11, where approximately 4.98 billion DOGE changed hands.
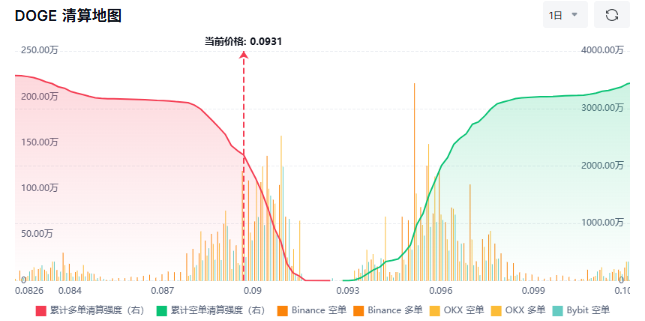
Image: Dogecoin Liquidation Map
Our analysis suggests that whales choosing to buy below resistance rather than at lows indicates their judgment is not a short-term bottom fishing attempt, but rather establishing a base position in advance for an accelerated rally after a breakout. However, whether these addresses are long-term believers or arbitrageurs waiting to sell requires subsequent price action to verify.
Why is Dogecoin's $0.10 Level So Hard to Break?
Why is Dogecoin's $0.10 level difficult to break? In our view, the root cause lies in the dual suppression from chip distribution and technicals.
Dogecoin Technical Analysis
According to Bijiie.com's Dogecoin chart, we note that the 7-day SMA is at $0.10, placing DOGE's current price below the short-term moving average; the MACD line and its signal line are almost overlapping, with the histogram reading zero, indicating buyers are clearly hesitant. The upper Bollinger Band is located exactly near $0.10, forming a resonance resistance with the psychological round number, while the daily ATR is only $0.01, with volatility continuously contracting, which typically ends with a sharp move in one direction.
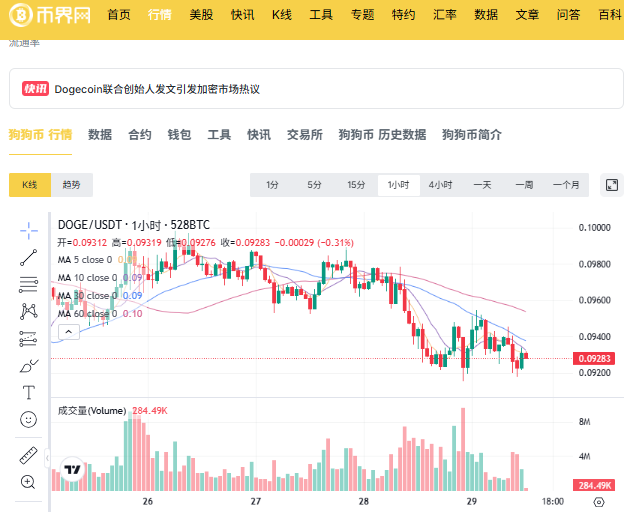
Image: Dogecoin Candlestick Chart Latest
Position Structure Analysis
Looking at Binance data, you will find a somewhat dangerous phenomenon:
Among "smart money" top traders, 76.4% are long, with a long/short ratio as high as 3.2; retail is the same, with 71.3% long. Think about it from another angle: if almost everyone is already on the long side, who will push the price next? Breaking $0.10 requires new buying, but these buyers may have already been in the market. In our view, the emergence of such crowded longs at a position with stalled momentum and strong resistance makes a downward liquidation highly likely if the breakout fails.Can ETF Inflows and Ecosystem Progress Become Breakout Catalysts?
The technical and position structure for Dogecoin are cautious, so can capital flows and ecosystem developments bring incremental buying? Let's look at the real quality of ETF and ecosystem progress.
Dogecoin ETF Capital Flows
According to SoSoValue data, for the week ending September 25, US spot Dogecoin ETFs recorded net inflows of $2.89 million, the highest single-week record since the product's launch, with cumulative net inflows rising to $15.27 million. The previous single-week high was $2.59 million, while last week's inflow was only $284,500, a significant marginal improvement. Grayscale's GDOG alone captured all $806,000 of Friday's inflows, currently holding $13.87 million in assets, accounting for approximately 81% of the total fund size in this category.
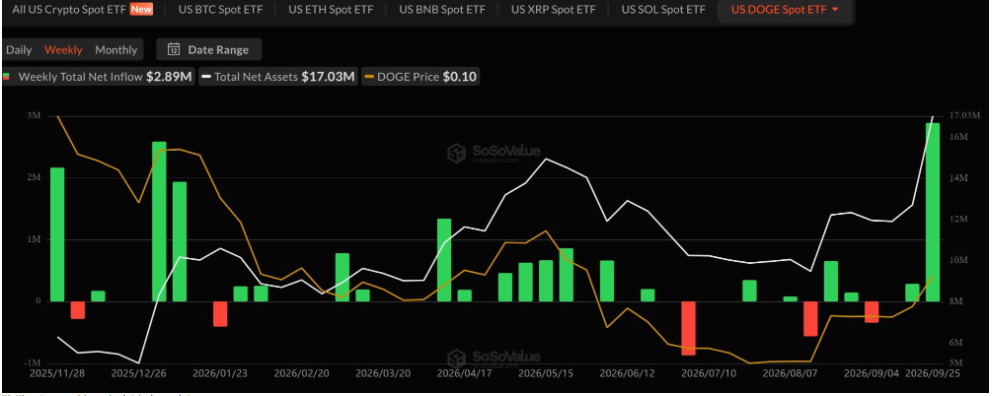
Image: Dogecoin ETF Net Inflows Reach $2.89 Million
Dogecoin Ecosystem
On the ecosystem side, Tesla is currently one of the few large public companies that accepts only Dogecoin as a cryptocurrency payment method, and its official support page has clear instructions on the DOGE settlement process. SpaceX confirmed that the launch service contract for the DOGE-1 lunar mission is paid entirely in Dogecoin. Additionally, X Money launched in April 2026, but the current version has not yet integrated DOGE payment functionality.
In our view, the recovery in ETF inflows and the Tesla payment scenario constitute medium-term positives, but DOGE ETF's cumulative $15.27 million scale accounts for only about 0.11% of DOGE's total market cap, with institutional participation still at an extremely low level. The value of ecosystem catalysts lies in providing narrative support rather than immediate buying, making it difficult to become a decisive driver for breaking $0.10 in the short term.
Can Dogecoin Break the $0.10 Mark?
Can Dogecoin break the $0.10 mark? We deduce the probability and path as follows:
The more likely current scenario is: DOGE continues to absorb overhead supply in the $0.098 to $0.10 range. If trading volume fails to effectively expand, it may first retest the $0.085 to $0.09 support area before seeking the next breakout opportunity. According to Blockchain.news analysis, the bearish scenario probability is approximately 55%, driven primarily by stalled momentum, crowded positions, and upper Bollinger Band pressure.
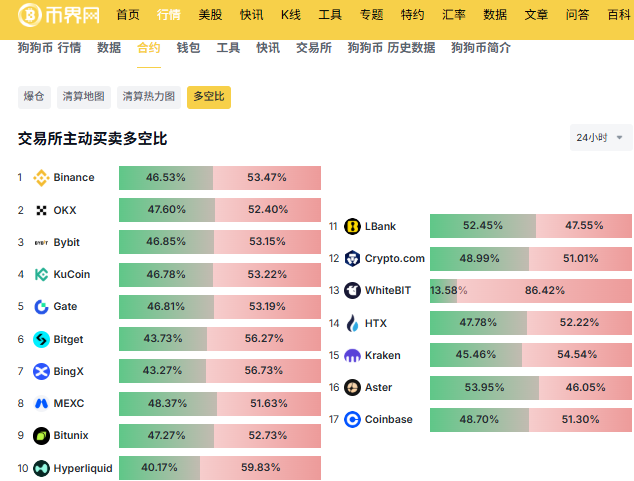
Image: Current Dogecoin Exchange Long/Short Ratio
Key conditions for the bullish path: a daily close above $0.10 and Binance spot single-day trading volume significantly exceeding $80 million. Once met, the first-stage target points to $0.12, and with accelerated momentum, the $0.13 to $0.14 range could be reached within 30 days. The invalidation conditions are equally clear: if an effective close above $0.10 cannot be achieved in the next 5 to 7 trading days, the compressed trend will most likely release downward. The $0.08 level below is the confluence of the lower Bollinger Band and the 50-day SMA, and also the last important line of defense.
Overall, continuous whale accumulation provides strong chip support below, and whether $0.10 can be broken ultimately depends on whether trading volume cooperates, rather than relying solely on faith in on-chain signals.
Dogecoin Price FAQ
Q1: How much does the record ETF inflow drive the price?
Short-term driving force is limited; medium-term narrative support is provided. For the week ending September 25, US spot DOGE ETF net inflows were $2.89 million, the highest single week since launch. But the DOGE ETF cumulative holdings account for only about 0.11% of DOGE's total market cap, an extremely small scale.
Q2: Once $0.10 is effectively broken, where is the next target?
The first-stage target points to $0.12. After the breakout, the first-stage target is $0.12; if momentum accelerates and attracts off-market capital, the $0.13 to $0.14 area could be reached within 30 days. Conversely, if an effective closing breakout cannot be achieved within 5 to 7 trading days, the compressed trend will release downward.

Q3: Where are the current key support levels for Dogecoin?
First support at $0.09, key defense at $0.08. The $0.09 level is a recent pivot point, having served as both support and resistance; the more important defense is at $0.08, where the lower Bollinger Band and 50-day SMA converge, and is the last important barrier against a structural collapse. If the daily chart closes below $0.09, it will open up approximately 20% downside space towards $0.08.
Conclusion
Our comprehensive analysis suggests that Dogecoin's latest price is at a critical decision point. The $112 million whale buying in 96 hours provides a chip foundation for breaking the $0.10 mark, and record ETF inflows signal tentative institutional allocation, but exhausted technical momentum and crowded long positions constitute short-term obstacles. Can the $0.10 mark be broken? The core variable is trading volume. If the daily chart closes above $0.10 with expanded volume, the bullish path will open, with the first-stage target pointing to $0.12; if an effective close cannot be achieved within 5 to 7 trading days, the compressed trend will likely first seek $0.08 support downward before gathering strength for the next attempt.
Disclaimer: Readers are strictly advised to comply with local laws and regulations. This article is compiled based on public market data for reference and educational purposes only, and does not constitute investment advice. Follow CoinMeta for the latest updates.