As of September 29, 2026, the trading price of Aave cryptocurrency was $166.39, and the prices on the daily, 1-hour, and 15-minute charts were almost identical. Such alignment usually indicates that the market is in a state of equilibrium, or that it may be about to experience a larger fluctuation. With momentum stretched across all time frames, the latter scenario seems increasingly likely.
Key Points
- The token price is $166.39, and RSI is in a stretched state across the daily (69.48), 1-hour (74.1), and 15-minute (72.84) time frames.
- The daily trend is still clearly bullish. EMA20, EMA50, and EMA200 maintain a correct upward sequence.
- The key resistance level is at $174.66 (daily chart R1), and the key support level is at $152.11 (daily chart S1).
- In the 15-minute MACD bar chart, the values have turned negative, indicating that the short-term momentum within a larger upward trend is weakening.
- If there is a valid breakthrough above $174.66, it can confirm a continuation of the upward trend; if it falls below $152.11, it will seriously challenge the bullish logic.
Broader market context
The total market value of cryptocurrencies is approximately $2.865 trillion, with a decline of 1.33% in the past 24 hours. According to aggregated market data, Bitcoin accounts for 58.79%. This indicates a slight decrease in risk appetite: while Bitcoin maintains its share, the overall market value has fallen, suggesting that funds have not actively shifted to altcoins. However, the Fear and Greed Index reading is 73, which is clearly in the “greedy” range. This sends a different signal: despite the cooling of the overall market value, market sentiment remains high.
The handling fee data from major decentralized exchanges shows a clear divergence. The daily handling fees of Uniswap V3 increased by 106.01%, but decreased by 27.22% over a 7-day period. Fluid DEX saw a single-day surge of 224.44%, but a weekly decrease of 15.38%. Meanwhile, according to DefiLlama data, the handling fees of Curve DEX dropped significantly, with a daily decrease of 44.09% and a 7-day decrease of 90.44%. This imbalance is important for lending protocols like Aave, as it occupies a central position in the liquidity flow of DeFi.
Daily chart structure: An upward trend has encountered overheating.

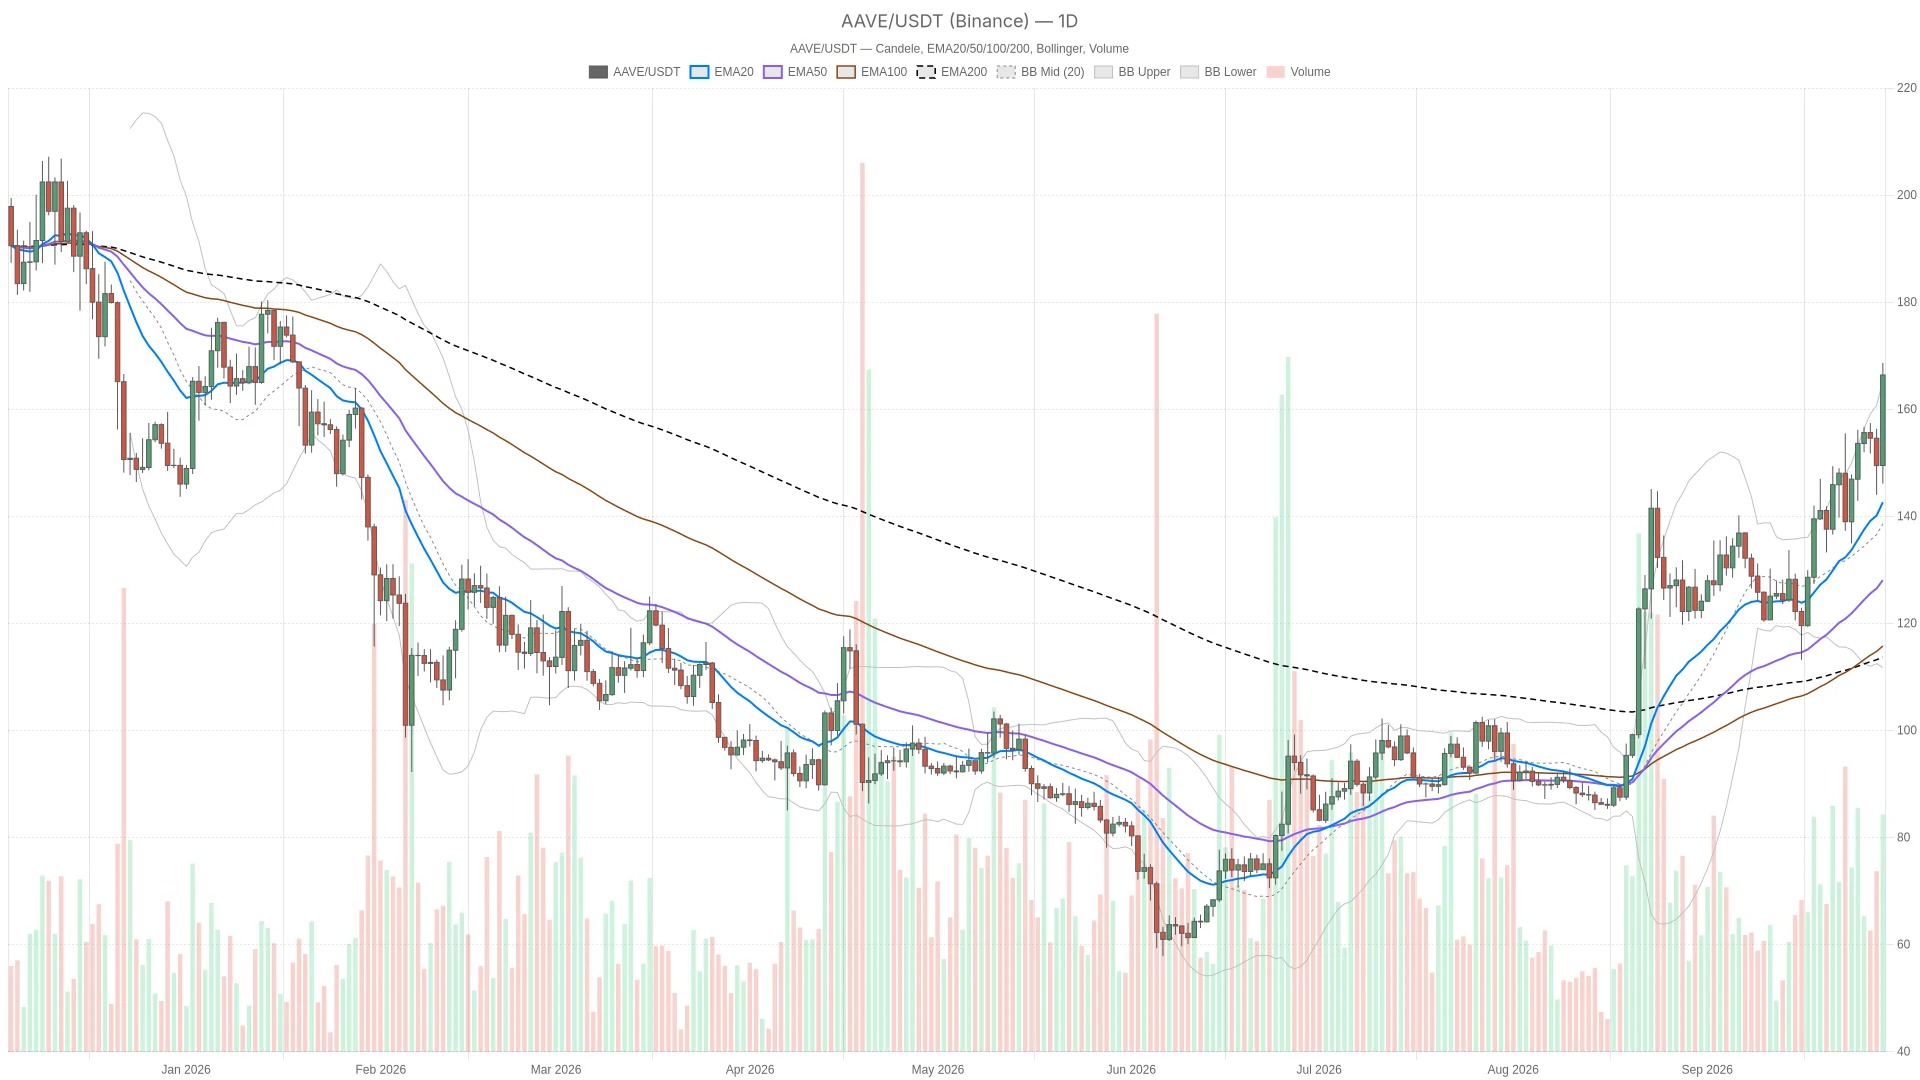
On the daily chart, at first glance, the trend framework appears to be the most dominant. The price of $166.39 is higher than EMA20 ($142.63), EMA50 ($128.07), and EMA200 ($113.73). All three moving averages are arranged in a bullish order and are spaced far apart, indicating that the trend has been in effect for some time. The daily chart label indicates a bullish trend, and MACD also supports this judgment. The MACD line is at 9.35, which is higher than the signal line of 7.57, and the bar chart shows a positive value of 1.78.
However, the daily RSI14 is at 69.48, which is right near the upper band of the Bollinger Bands at 165.43. This indicates that the asset has technically broken through its own range of fluctuations slightly. The daily ATR14 is at 11.64, reflecting a typical one-day range of movement. If the price remains above the upper band and the RSI is close to 70, there are usually two possibilities: either it will continue to break through strongly, or it will quickly revert to the average, falling back to the middle band of 138.6. Both scenarios are currently present.
On the daily chart, the pivot point is at 160.37, resistance is at 174.66, and support is at 152.11. If it can cleanly break through $174.66, it will validate the breakout scenario. If it loses $152.11, it will more clearly indicate that the upward trend is losing its momentum.
Intraday Cycle: The Clash of Momentum and Fatigue
The 1-hour period generally confirms the bullish judgment on the daily chart, but it also adds a sense of urgency. The price of $166.40 is higher than EMA20 (155.06), EMA50 (152.69), and EMA200 (147.45). The MACD bar chart for this period is relatively stronger at 2.33, and the MACD line at 3.83 is significantly higher than the signal line at 1.50. The status label for this period is also bullish. However, the 1-hour RSI14 has risen to 74.1, entering the overbought zone more deeply than on the daily chart, and the price is almost exactly at the upper band of the Bollinger Bands at 166.78.
The 15-minute chart marks the first sign of a rift in the narrative. Here, RSI14 is at 72.84, which is still on the high side, but the bar chart for MACD has turned negative, at -0.30. The larger trend structures—EMA20 at 163, EMA50 at 157.19, and EMA200 at 152.84—are still intact. In fact, this indicates that the short-term momentum is cooling down, while the overall trend remains upward. This is a typical case of hesitation below a resistance level, rather than a direct reversal. The pivot range for the 15-minute period is very narrow, with resistance at 166.54 and support at 166.18.
Bullish and bearish scenarios
If the buying pressure can absorb the overbought condition without a real pullback, the minimum resistance path remains upward. If the price continues to break through the 1-hour resistance range of $166.78 to $167.40 and further advances towards the daily R1 of $174.66, then a continuation of the upward trend can be confirmed. This is likely to trigger a new round of gains with the support of the EMA structure, which is still on the rise across three time frames. If there is a decline, the token must hold above the 1-hour EMA20 of $155.06 for this scenario to remain valid.
If the price fails to break through the range of $166.78 to $167.40 and instead starts to decline, then a mean reversion scenario will gradually take shape. If it falls below the 1-hour support level of $165.44 and further loses the daily pivot point of $160.37, it will open up space towards the daily target of $152.11. The middle band of the Bollinger Bands at $138.6 will also become a realistic downward target again. The negative MACD bar chart that has already appeared on the 15-minute chart will be the first confirmation signal of this shift. If it begins to drag down the 1-hour bar chart, then the bullish logic must be re-evaluated, rather than continuing to hold on stubbornly.
Position and Risk
Currently, Aave cryptocurrencies are in a trend that has gained respect, but at the same time, overbought warnings are also being issued continuously. RSI is on the high side in all three time frames, with prices closely above or at the upper band of the Bollinger Bands, and there has already been a divergence in momentum in the fastest time frame as well. None of these factors alone would negate an upward trend. In a strong trend, the state of overboughtness often persists longer than traders expect, and the 11.64 level on the daily chart ATR suggests that there could be significant two-way fluctuations within a single trading day.
But what this form truly implies is that confidence should be based on confirmation, rather than on how good a trend may have seemed before. The range of $165 to $167 will determine the next real direction choice. Until then, both scenarios are equally possible.
Frequently Asked Questions
Aave What is the current price?
As of September 29, 2026, the trading price of this token on the daily chart was $166.39, the closing price for the 1-hour time frame was $166.40, and the closing price for the 15-minute time frame was $166.37 – there is an exceptionally tight alignment among these three time frames.
Aave is it in an overbought area?
Yes. The daily line RSI14 is at 69.48, the 1-hour line is at 74.1, and the 15-minute line is at 72.84. All three time periods show higher readings, with the 1-hour line clearly exceeding the overbought threshold of 70.
Where are the key support and resistance levels?
The daily pivot point is at $160.37, the resistance level is at $174.66 ( R1 ), and the support level is at $152.11 ( S1 ). On the 1-hour chart, the recent resistance is around $166.78 to $167.40, and the most recent support level is at $165.44.
This article was generated with the assistance of artificial intelligence and has been reviewed by an editorial team.