As of September 29, 2026, the trading price of Firo cryptocurrency was approximately 0.30 US dollars, which is significantly lower than all major daily moving averages. CoinGecko data shows that the total market value of cryptocurrencies is close to 2.86 trillion US dollars, but even with a Fear and Greed Index of 73, the sellers of FIRO still hold a firm dominant position.
Key Points
- As of September 29, 2026, the price of FIRO trades around $0.30, below all major daily moving averages.
- The daily line RSI is at 22.79, indicating severe overselling, but a trend reversal has not yet been confirmed.
- Bitcoin dominates with a rate of 58.79%, continuing to limit the flow of funds towards smaller-cap altcoins.
- The key support level is at $0.18333, and the daily pivot resistance level is at $0.37167.
- The total market value of cryptocurrencies is approximately $2.86 trillion, and the Fear & Greed Index reads 73, indicating "greed."
Confirm bear market structure on the daily chart
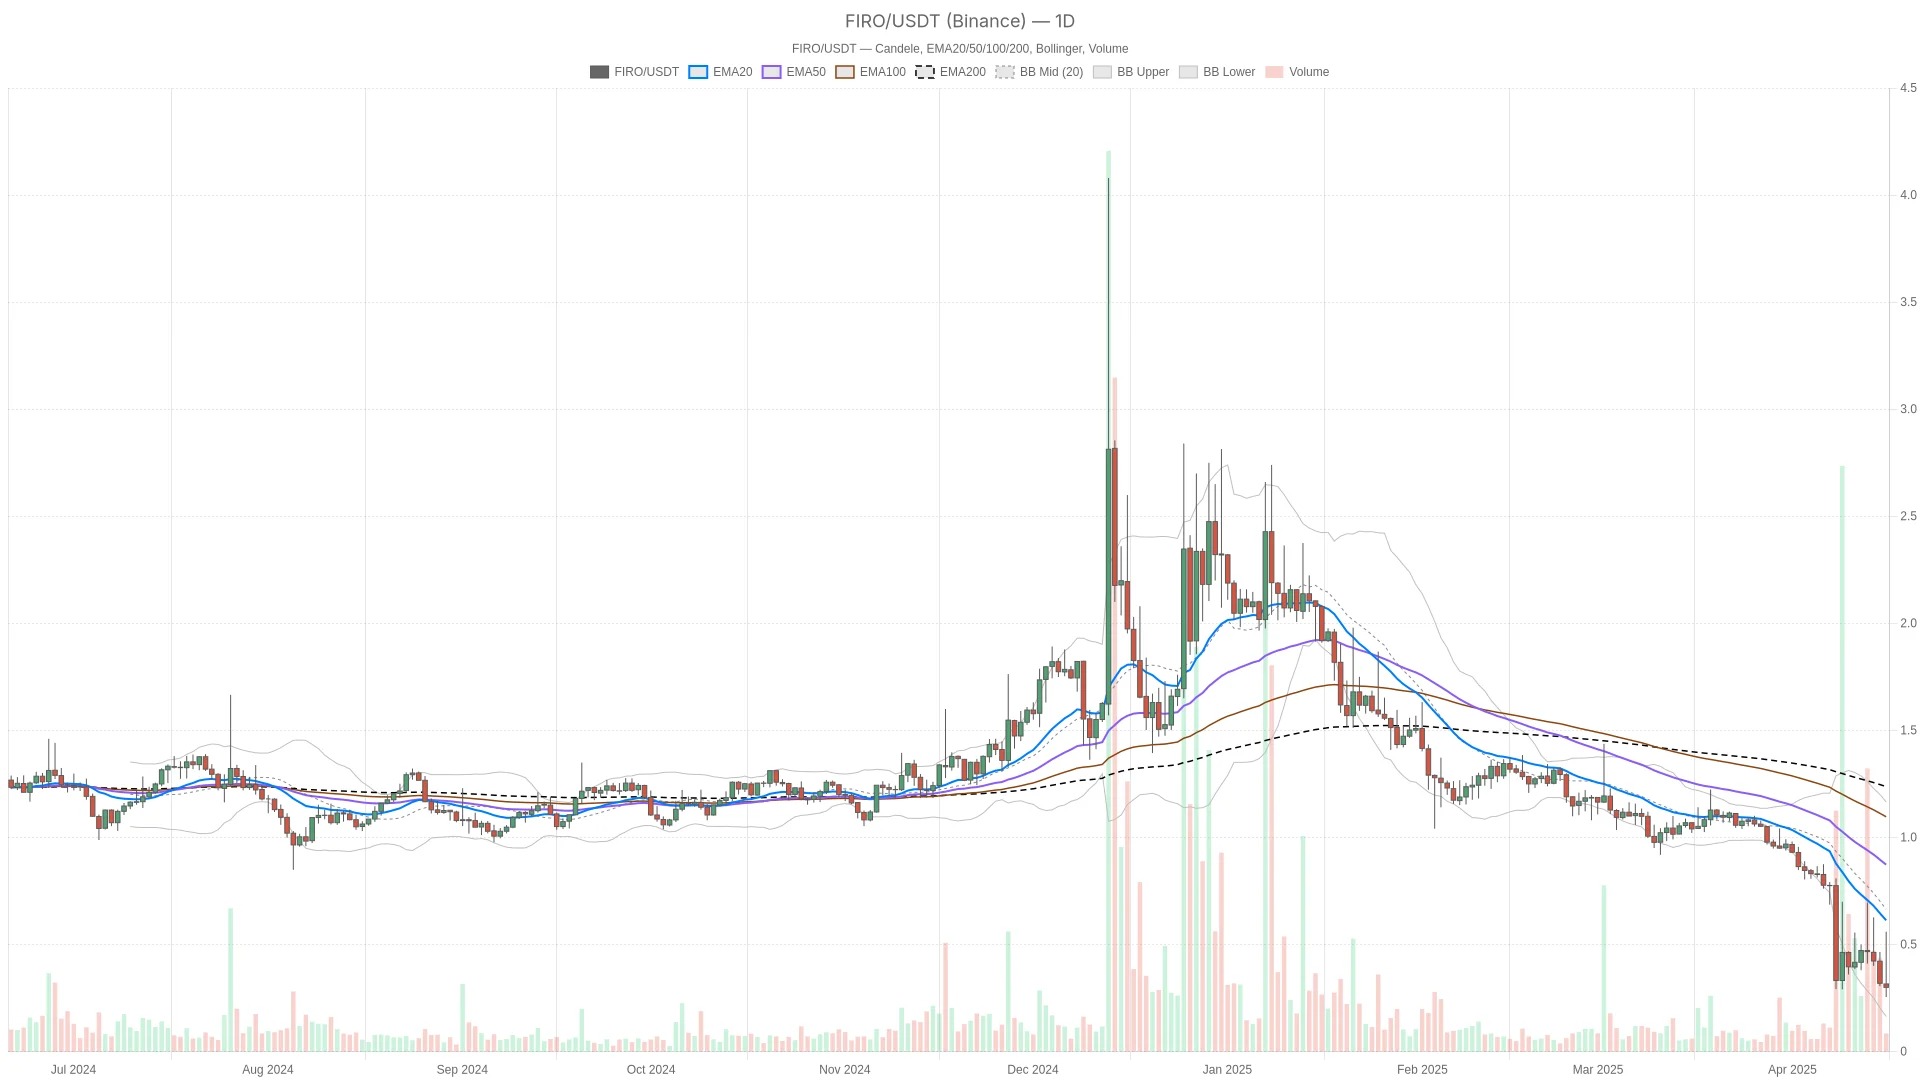
The daily chart is almost unequivocal – FIRO is in a structural downtrend, and no confirmed reversal is visible at present. The price is at $0.30, which is below EMA20 ($0.613), EMA50 ($0.873), and EMA200 ($1.2376). All moving averages are stacked above the current closing price in a bearish manner. EMA200 is at $1.2376, more than four times higher than the current price.
However, the daily RSI14 level is at 22.79, which indicates that it is deeply in an oversold zone. In a healthy market with fluctuating ranges, this would usually be a strong contrarian signal. But in a trend that has extended so far, the oversold condition may persist longer than traders expect. The daily MACD further reinforces a cautious attitude: the MACD line is at -0.184, below the signal line of -0.156, and the bar chart shows -0.027. Momentum is still pointing downwards, indicating that sellers have not yet lost control.
The daily Bollinger Bands (middle band at $0.665, upper band at $1.166, lower band at $0.164) indicate that the price is close to the lower half of the channel. Firo The price has not yet touched the lower band, and the width of the Bollinger Bands suggests that the asset has already experienced significant movements in the past—there is still room for further movement towards the extreme positions. ATR14 With a width of 0.193, and considering an asset price of $0.30, this means that the daily fluctuation range could be approximately two-thirds of the current price.
In addition, the daily pivot structure also reinforces the bearish trend: the pivot point is at $0.37167, the resistance level is at $0.48833, and the support level is at $0.18333. If the price remains below the pivot point, it indicates that the intraday trend is still downward. Moreover, the support level of $0.183 coincides conceptually with the lower band of the Bollinger Bands; if selling pressure intensifies again, this area deserves attention.
Low-cycle momentum has stagnated, but it has not yet reversed.
The 1-hour chart still confirms a bearish market environment, but the marginal pressure has eased somewhat. EMA20 (0.354 USD), EMA50 (0.391 USD), and EMA200 (0.475 USD) are all still above the price level, so the intraday trend is in complete agreement with the daily chart narrative. RSI14 has risen to 37.64, which is still below 50, but not as extreme as on the daily chart. The bar chart for H1 MACD is only slightly negative at -0.004, while MACD is at -0.028, and the signal line is at -0.024—indicating that momentum is weakening rather than accelerating downward.
On the 15-minute chart, the situation further tends to become balanced. At RSI14, it is at 44.47, which is basically neutral. The bar chart for MACD is almost flat at -0.00072, and the line for MACD (-0.0125) almost coincides with the signal line (-0.0117) – indicating that momentum has stalled rather than reversed. The price is around $0.30, fluctuating precisely around M15 EMA20 ($0.30995), and is below EMA50 ($0.333) and EMA200 ($0.391). This suggests that it is more likely a short-term consolidation area rather than the beginning of a new downward trend.
It is worth noting this tension: the daily chart still shows oversold conditions and a bearish structure, with downward momentum; however, the intraday chart indicates that momentum is beginning to level off. This is more likely a pause within a larger downtrend rather than a confirmed bottom. In such a pattern, a rebound is possible, but there is still a lack of evidence at the trend level to support it.
Bullish scenario
The recovery path for FIRO first requires regaining the daily pivot point of $0.37167. If buyers are able to push prices above this level and further above H1 EMA50 ($0.391), then the oversold condition on the daily chart of RSI will transform from a mere warning signal into a real driving force. With that, prices are expected to test the daily resistance level of R1 at $0.48833. However, for this scenario to be truly credible, the candlestick chart of MACD needs to start converging towards the zero axis, which is not currently the case. If the support area of $0.18333 cannot be held, this scenario will completely fail.
Bearish scenario
In contrast, the bearish scenario is simpler, as it represents the path with the least resistance: if prices continue to remain below the daily pivot point, the level of $1.2376 for EMA200 remains out of reach. However, once prices fall below $0.18333, it will open up space towards $0.164, near the lower band extreme of the daily Bollinger Bands. As long as the daily MACD bar chart remains negative and RSI cannot firmly return to the 40 to 50 range, this scenario remains valid. If the daily close reclaims the level of EMA20 ($0.613), that would be the clearest signal that the bearish structure is beginning to break down—but that is still a long way from the current price.
Positioning and Risk Management
FIRO is at a point where there is a slight divergence between the overall trend and short-term momentum, and this inconsistency is precisely why caution is even more needed at present than a firm judgment. Just the daily ATR indicates that prices can experience significant fluctuations within a single trading session. The overall market fear and greed index of 73 does not mean that altcoins like FIRO will necessarily benefit from an optimistic sentiment—dominant liquidity data shows that liquidity is still mainly concentrated in Bitcoin, accounting for 58.79%. Investors tracking FIRO should regard the daily RSI oversold condition as a signal that requires close observation, rather than an independent buying signal, and should consider the daily pivot points as well as the range of $0.18333 to $0.48833 as key levels that will determine the next direction of the trend.
Frequently Asked Questions
FIRO What is the current price?
As of September 29, 2026, the trading price of FIRO was approximately 0.30 US dollars, which is below all the major moving averages on the daily chart, including EMA200 at 1.2376 US dollars.
Why does FIRO still perform poorly when the market is in a state of greed?
Bitcoin dominates with a share of 58.79%, absorbing most of the available liquidity, leaving not much capital for small-cap altcoins like FIRO. Although the Fear and Greed Index shows a level of 73 ("greedy"), this optimism has not evenly spread throughout the market.
FIRO What are the current key support and resistance levels?
The daily pivot point is at $0.37167, the resistance level is at $0.48833, and the support level is at $0.18333. On the downside, $0.164, near the lower band of the daily Bollinger Bands, is also an additional level that needs attention when selling pressure intensifies.
This article was generated with the assistance of artificial intelligence and has been reviewed by an editorial team.