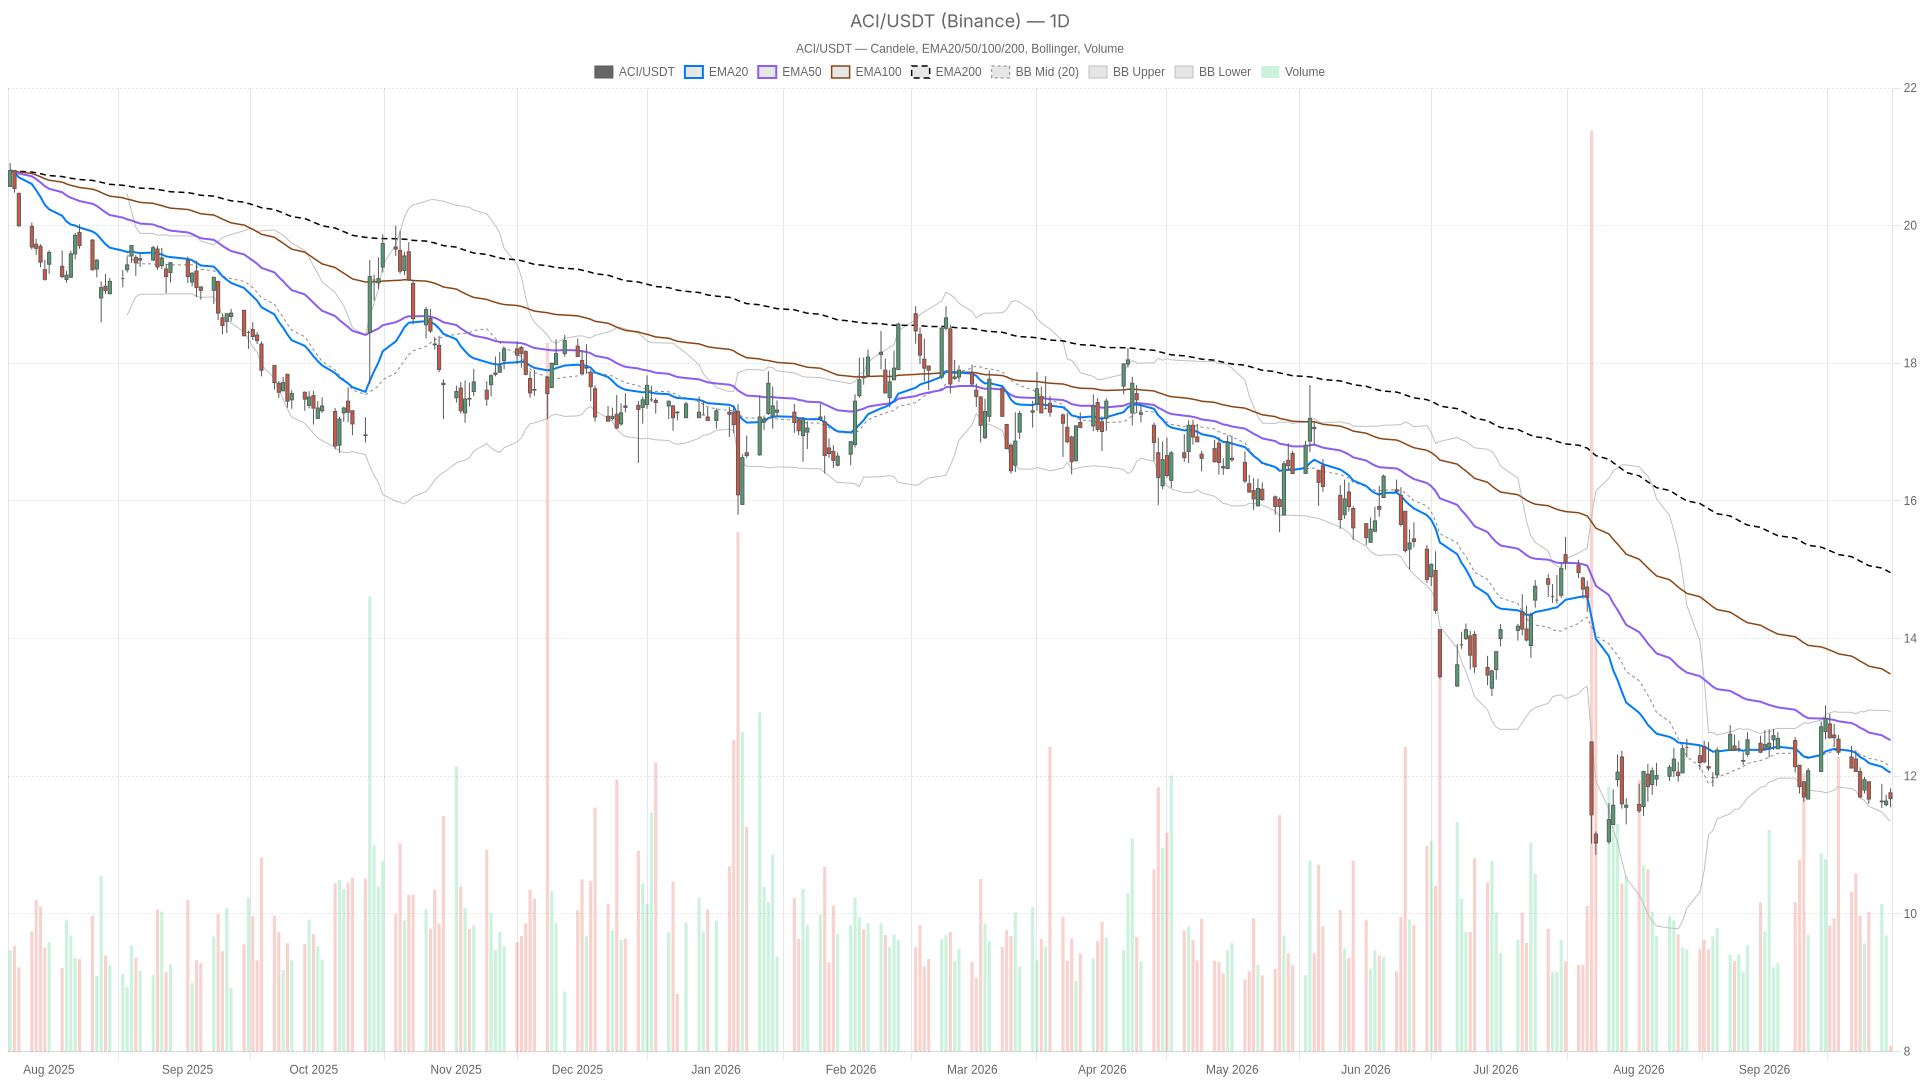
Albertsons Companies ( ACI ) The stock price closed at $11.675 on Wednesday, September 30, 2026, at 2:21 PM Eastern Time, up 0.3% from the previous trading day's closing price of $11.64. However, this slight increase did not change the overall bearish trend, as the stock price is still significantly below all major moving averages.
Key Points
- Albertsons Companies The stock price is reported at $11.675, still within a bearish trend, below all major moving averages.
- The daily line RSI is at 40.43, while MACD is negative, indicating that the downward momentum is still present.
- The range of $11.54 to $11.82 is currently the key battleground, but the overall trend still favors the bears.
- The hourly chart shows a brief pause in momentum, but no reversal signals have yet appeared.
- The daily line ATR14 is at $0.36, showing moderate fluctuations. The pivot area remains a region that requires close attention.
Daily trend: Bearish sentiment still dominates
There were no specific company-related announcements during today's trading session. The following analysis is based solely on price structure, momentum, and volatility.
Moving Average Alignment and Momentum

On the daily time frame, the price of $11.675 is lower than the 20-day EMA of $12.05. This EMA in turn is lower than the 50-day EMA of $12.52, and the 50-day EMA is lower than the 200-day EMA of $14.94. This constitutes a complete bearish pattern: the price is below EMA20, EMA20 is below EMA50, and EMA50 is below EMA200. It can almost be said that this is one of the most clear characteristics of a downward trend on the chart.
Kinetic energy also confirms the same conclusion. The daily RSI indicator shows 40.43, which is significantly lower than the neutral line of 50, but it has not yet deeply entered the oversold area. This means that there is still room for the downtrend to continue before excessive stretching of the readings forces a market reaction. Meanwhile, the daily MACD indicator is at -0.20, below the signal line of -0.14, and the bar chart shows -0.06. Both the line and the signal are in negative territory, and the bar chart also confirms that the bearish bias is still in effect and not weakening.
Volatility and Pivot Point Background
The Bollinger Bands provide a context for volatility. The middle band is at $12.14, the upper band at $12.94, and the lower band at $11.35. The price is located in the lower half of this range, closer to the lower band than to the middle band. This is consistent with the characteristics of a market under pressure, rather than a market that is in consolidation. The daily ATR14 is $0.36, which reflects the actual range of fluctuations visible for this stock within each trading day.
The pivot point outlines the short-term contention area. The daily pivot point is at $11.68, which is almost consistent with the current price. The resistance level is at $11.82 ( R1 ), and the support level is at $11.54 ( S1 ). Therefore, the stock price of Albertsons Companies is actually staying above its own pivot point. The next direction signal will likely depend on which side is broken through first.
Hourly chart: It's just a pause, not a reversal.
On the 1-hour chart, the structure is still relatively bearish, but not as clear as on the daily chart. The price of $11.68 is slightly lower than the 20-hour EMA level of $11.69. This $11.68 is in turn lower than the 50-hour EMA level of $11.84, and the 50-hour EMA level is lower than the 200-hour EMA level of $12.12. The result is the same as on the daily chart; it remains a bearish pattern, albeit confined within a narrower range.
However, the momentum during this period tells a slightly different story. The hourly RSI reading is 47.09, which is basically neutral. The MACD bar chart shows a slight positive value of 0.02, while the MACD line is at -0.04, which is higher than the signal line of -0.06. This is a small but noteworthy deviation. Technically, the hourly trend remains bearish, but the short-term momentum is no longer accelerating downward. In reality, this seems more like a pause within a larger downward trend, rather than an extension of that continuous decline.
The hourly Bollinger Bands show that the middle band is at $11.66, the upper band at $11.79, and the lower band at $11.54. The price is slightly above the middle band. Considering the ATR14 of $0.12, the hourly range has significantly narrowed compared to the daily chart. This is consistent with the market being in a state of rest rather than making a decisive directional choice.
15-minute chart: Reference at the execution level
Zooming in to a 15-minute chart, the price level becomes neutral. The price of $11.68 is almost exactly above the $11.67 levels of both the 20-period EMA and 50-period EMA indicators, with the two lines almost overlapping. The 200-period EMA indicator shows a higher level at $11.93. The RSI indicator reads 50.83, which is in the middle position. Both the MACD line and the signal line are at 0.01, and the bar chart also shows a flat value of 0.00.
In short, the shortest time frame shows indecision. The 15-minute pivot point is at $11.67, with resistance at $11.68 and support also at $11.67. This extremely narrow range indicates that the market is waiting for a catalyst rather than making a decision on the direction to take. The significance of this time frame lies in identifying the right entry points around the pivot range of $11.67 to $11.68, rather than determining a larger trend.
Albertsons Companies Bullish Scenario for Stock Prices
For the bullish scenario to take hold, the Albertsons Companies stock price needs to firmly recover the daily pivot point of $11.68. Subsequently, it also needs to break through the $11.82 level of R1. If it can successfully re-establish itself above the 20-day EMA level of $12.05, that would be the first real signal that the bearish structure is beginning to weaken.
On the hourly chart, it would also be helpful if the MACD bar chart continues to expand into the positive territory. A clear rise above 50 for RSI would also provide support. Only when these two factors are combined can it indicate that the current pause is transforming into a genuine recovery, rather than a temporary stagnation.
Albertsons Companies Bearish Scenario for Stock Prices
Given the daily chart arrangement, the most feasible scenario is still a bearish outlook. If the price falls below the daily support level of $11.54 (S1), it will create room for a decline towards the lower band of the Bollinger Bands at $11.35. This would further reinforce the downward trend that has been keeping the price below the 20-day, 50-day, and 200-day moving averages (EMA).
If the hourly chart MACD bar chart turns negative again, and RSI falls below 47, then the current brief stabilization is likely to fail. New selling pressure will subsequently negate any early bullish attempts.
Summary
Overall, the daily trend of Albertsons Companies's stock price remains bearish. The price is trapped below a set of neatly arranged moving averages, and the momentum is still leaning downward. At the same time, the hourly chart shows some subtle changes indicating that the downward momentum has paused briefly, but a reversal has not yet been confirmed.
In contrast, the 15-minute chart only shows short-term noise near the pivot point, which is suitable for reference at the execution level, but it is not sufficient to provide confidence regarding the direction. Considering that ATR14 indicates moderate intraday fluctuations, the range between $11.54 and $11.82 should be regarded as a key battleground. The broader technical context still favors caution rather than complacency.
Frequently Asked Questions
Albertsons Companies What is the current trend of the stock price?
The daily trend is bearish, with prices below the 20-day, 50-day, and 200-day EMA levels, forming a complete bearish pattern. The daily RSI is at 40.43, and the MACD is negative, confirming that the downward momentum remains.
ACI What key price levels need to be watched?
Support level is at $11.54 ( S1 ), and the lower band of the Bollinger Bands is at $11.35. Resistance level is at $11.82 ( R1 ), with the 20-day EMA at $12.05. A breakthrough of either boundary could determine the direction for the next move.
Are there any signs of a trend reversal?
The hourly chart shows a brief pause in downward momentum. The MACD bar chart has turned slightly positive, and the RSI is approaching neutral. However, a reversal has not yet been confirmed. The bearish structure on the daily chart still dominates.
This article was generated with the assistance of artificial intelligence and has been reviewed by an editorial team.