Option Care Stock ( OPCH ) closed at $31.055 on Tuesday at 10:00 AM Eastern Time, up 32.88% from Monday's closing price of $23.37. Previously, Seeking Alpha reported that McKesson and Clayton Dubilier & Rice had agreed to acquire Option Care Health for a transaction amount of $5.8 billion. Now, this deal is far more influential in shaping the chart trend than any technical signals.
Key Points
- As of 10:00 a.m. Eastern Time on Tuesday, OPCH was trading at $31.055, representing a 32.88% increase from Monday's closing price of $23.37.
- The daily line RSI14 is at 83.76, which is above the overbought threshold of 70.
- On the daily chart, MACD, the bar chart shows a value of 0.44, and it crosses above the zero axis within the main K-line.
- The stock price is higher than the daily highs of $24.03, $23.61, and $25.26 respectively.
Option Care Stock price rises due to acquisition agreement
Before the acquisition news emerged, another article published on Wednesday, September 30th, Yahoo Finance, compared Option Care Health's home infusion business with BrightSpring Health Services. That report questioned whether the stock was still undervalued. However, the transaction price reported by Seeking Alpha this week has overshadowed those previous comments.
Daily chart has entered overbought territory.

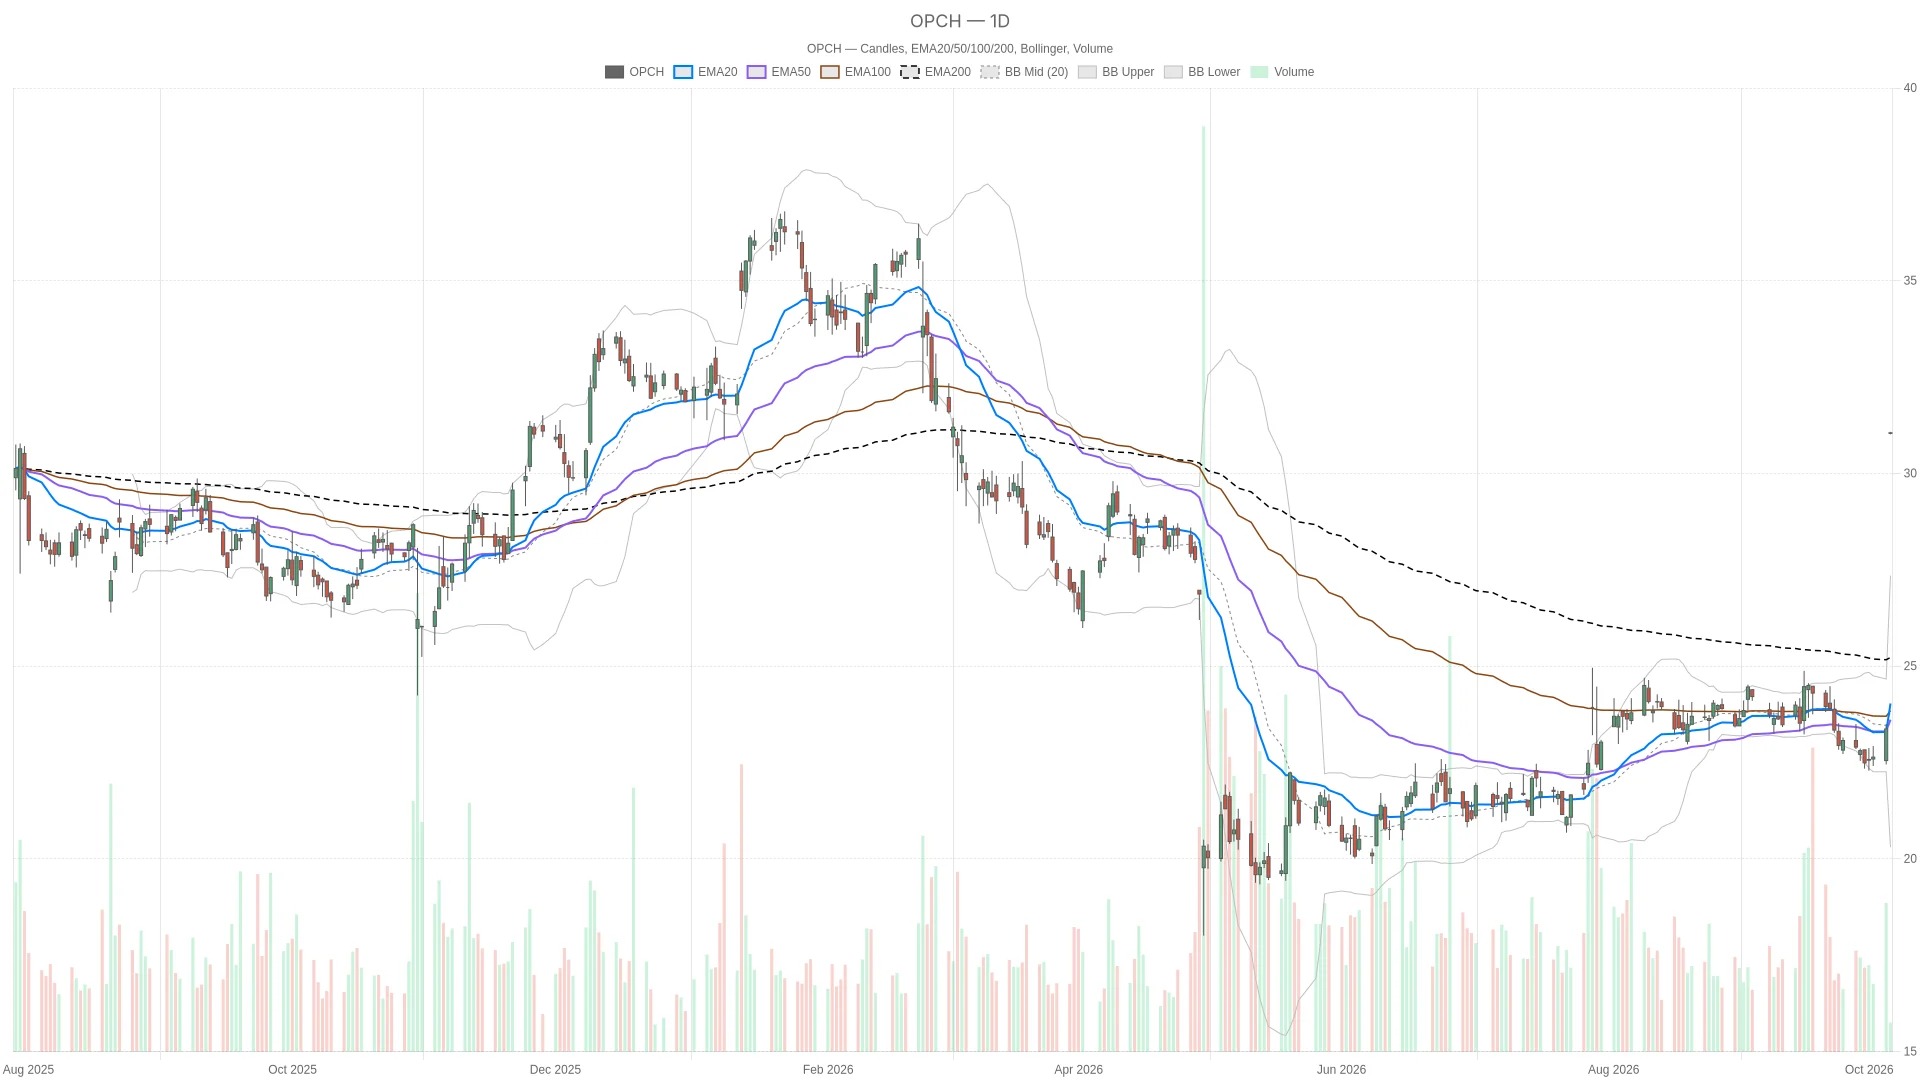
From the daily chart perspective, this gap reflects strong momentum. The daily RSI14 level is at 83.76, which is significantly higher than the overbought threshold of 70.
The stock price is above the daily level of EMA20 at $24.03, as well as above EMA50 at $23.61, and also above EMA200 at $25.26. However, the arrangement of the moving averages is not entirely neat: EMA50 is lower than EMA20, and EMA20 is in turn lower than EMA200.
The upper band of the daily Bollinger Bands is at $27.35, and the current price is already above that level. The daily pivot point is at $23.1, R1 is at $23.76, and S1 is at $22.72. The stock price is significantly higher than R1.
Hourly chart and 15-minute chart confirm a breakout.
At the same time, the hourly chart trend is consistent with the daily chart trend. The value on the hourly chart RSI14 is 94.46, which is significantly higher than 70 and indicates an extreme overbought condition.
The 15-minute chart shows that RSI14 is at 97.35, which is basically the same as the previous K-line value of 97.41. Both readings are in a state of extreme overbought.
On the surface, both the hourly chart and the 15-minute chart show RSI14 values above 90, which usually indicates that the trend may be weakening. However, in this case, these extreme readings are due to gaps related to the acquisition price. This distinction is important: when prices are re-priced around a fixed quote, the usual significance of overbought warnings is diminished.
Option Care Bullish Scenario for Stocks
For the stock price of Option Care, a relatively positive scenario requires the price to remain above the upper band of the daily Bollinger Bands at $27.35, and also above the daily R1 level of $23.76. The daily MACD bar chart also needs to maintain positive values.
On the hourly chart, as long as the price holds at $23.53, which is EMA200, and the pivot point of $23.38, the breakout structure remains valid. For the 15-minute period, if the price stays above $31.09, which is R1, it will indicate that buyers are continuing to push the price above the current range top.
Bearish scenario: Under what circumstances would this trend be negated?
On the other hand, if the price breaks below the daily level of $24.03 (EMA20) and falls back to around the daily pivot point of $23.1, it could be seen as a reversal scenario. This means that most of today's gap-up gains will be reversed.
On the hourly chart, if it falls below $23.53, which is EMA200, or the pivot point of $23.38, it will weaken the assumption that this trend is still continuing. For the 15-minute chart, if it falls below the pivot point of $31.05 and further loses support at $31.02, which is S1, it indicates that short-term sellers are re-entering the market.
Overall, as of 10:00 Eastern Time, the stock price of Option Care Health is at $31.055, which is significantly higher than the weekly pivot point of $23.1 on Tuesday and its R1 of $23.76. Prices in all time frames are above their respective Bollinger Bands upper bands. The daily ATR14 has risen from 0.66 to 1.16. What remains uncertain at this time is whether the price will stabilize around the trading price of $32.05 per share reported by Seeking Alpha, or whether today's extreme overbought readings will lead to a pullback before the close of trading.
Frequently Asked Questions
What drove the rise in the stock price of Option Care on Tuesday?
Seeking Alpha reports that McKesson and Clayton Dubilier & Rice have agreed to acquire Option Care Health for a transaction amount of 5.8 billion US dollars.
From the daily chart, how overbought is the stock price of Option Care?
The daily line RSI14 is at 83.76, which is above the overbought threshold of 70. The daily line MACD bar chart shows a value of 0.44, and it is also positive. The stock price is above the upper band of the daily Bollinger Bands at 27.35 US dollars, as well as above the three-day moving average.
What key support levels need to be watched out for?
On the daily chart, $24.03 for EMA20 and the daily pivot point of $23.1 are key supports. On the hourly chart, $23.53 for EMA200 and the pivot point of $23.38 are important levels that need to be held.
What is the significance of the level of $32.05?
Cryptonomist and the author do not hold any positions in the financial instruments mentioned in this text, nor have they received any compensation from the companies reported.
This article was generated with the assistance of artificial intelligence and has been reviewed by an editorial team.