

As of press time, ETH is hovering around $2,565, nearly doubling to $5,000 but only a step away from $2,500. Supply tightening, ETF inflows, L2 value leakage, and hawkish Fed signals are engaged in a fierce tug-of-war.
Table: Ethereum Latest Key Data
| Data | Latest Value |
|---|---|
| ETH Spot Price | ~$2,544–$2,578 |
| ETH Market Cap | ~$314 Billion |
| 24h Trading Volume | ~$19.5 Billion |
| Total Staked | ~43.74 Million ETH |
| Exchange ETH Reserves | Only 3.49% of Total Supply |
| Staking Queue | ~1.68 Million ETH Waiting to Stake |
| L2 Total Value Locked | ~$5 Billion |
| Spot ETF Fund Flows | 7 consecutive trading days of net outflows, totaling ~$451 Million |
| Average Daily Gas Fee | 2.9 Gwei, average daily fee ~$0.85 |
| ETH Network-wide Open Interest | ~$35.3 Billion, up 5.18% in 24 hours |
Note: The above content is compiled and summarized by CoinMeta based on public market data. Please refer to actual data if there are any fluctuations.
What Is Driving Ethereum Toward $5,000 in October?
What is driving Ethereum to break $5,000 in October? Our analysis finds this is related to the resonance between supply tightening and institutional entry.
Ethereum's Supply Tightening
Our review of CryptoQuant data shows that since 2026, exchange ETH reserves have continuously declined from 16.86 million in January to 15.12 million, a decrease of about 1.74 million. Meanwhile, total Ethereum staking has climbed to 43.74 million, accounting for over 35% of total issuance. Currently, about 507,000 ETH remain in the consolidation queue.
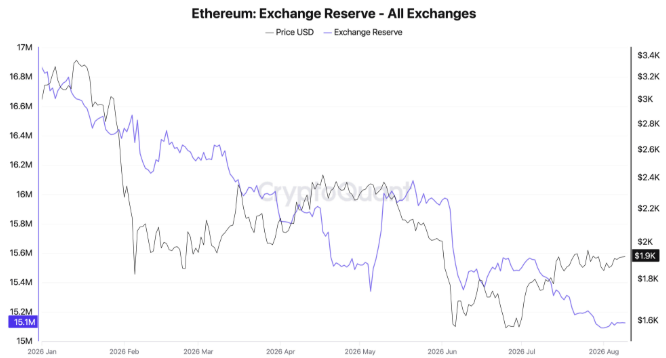
Image: Exchange ETH Reserve Changes
You can think of exchanges as ETH's "spot shelves." There are fewer coins on the shelves and more coins locked in staking and custody. In our view, this reduces the ETH actually available for free trading, making the price easier to push upward.
Return of Institutional Capital
In the first half of 2026, Ethereum ETFs experienced about $5 billion in net outflows, but in the third quarter the situation reversed, with net inflows of about $6.3 billion.
| Product | ETH Holdings | 1-Day Net Flow | 7-Day Net Flow |
|---|---|---|---|
| ETHA | 3,580,580 ETH | -75,810 ETH | -95,117 ETH |
| Grayscale | 1,649,590 ETH | +181 ETH | -17,006 ETH |
| FETH | 561,541 ETH | +1 ETH | -32,222 ETH |
| ETHW | 111,249 ETH | 0 | -18 ETH |
| ETHV | 46,749 ETH | 0 | -2,565 ETH |
| Total | 5,989,557 ETH | -75,628 ETH | -149,200 ETH |
On October 5 alone, BlackRock's ETHA recorded $130 million in net inflows, bringing its historical total net inflows to $13.4 billion.
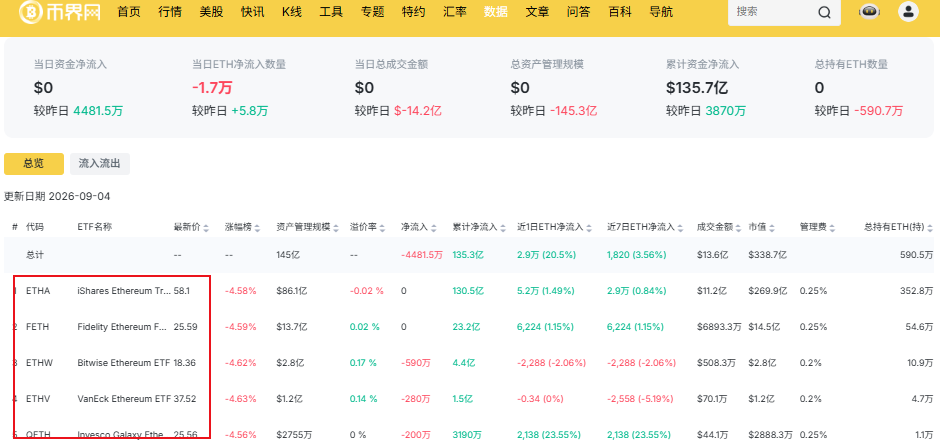
Image: Ethereum ETF Overview
According to CoinMeta data, as of October 7, 2026, the 7-day cumulative net outflow was about 149,200 ETH, equivalent to approximately $382 million. From September 29 to October 6, spot Ethereum ETFs had net outflows for six consecutive trading days, totaling approximately $408 million. The Ethereum ETF net asset ratio fell from 5.38% to 5.27%.
In addition, Arthur Hayes explicitly pointed out that Robinhood's adoption of Ethereum in its blockchain significantly lowers the access threshold for large financial institutions, and ETH's price could rise to $5,000 within about a year.
What Are the Risks of Ethereum Falling Back to $2,500 in October?
In our view, the bearish case for Ethereum falling back to $2,500 in October also has solid data support.
Ethereum's Value Dilemma
The core concern comes from the value leakage in Ethereum's Layer 2 ecosystem. L2BEAT data shows that as of July 2026, the total locked value of Ethereum Rollups had plummeted from over $48 billion at the beginning of the year to about $5 billion, almost erasing all gains from 2024. L2 networks such as Base and Arbitrum carry increasingly more transaction activity, but the fees and value capture generated by these activities have not effectively flowed back to the Ethereum mainnet.
We note that the current Ethereum mainnet DeFi TVL is approximately $41 billion. The "scissors gap" between this and L2 TVL reveals an awkward reality: network usage is growing, but ETH's value capture mechanism is being diluted.
Macro Pressure
Macro-level pressure on Ethereum continues to weigh on risk assets. Federal Reserve Chair Warsh's first rate hike after taking office raised rates by 25 basis points to 3.75%-4.00%. The dot plot indicates further rate hikes are possible in 2026, and the 10-year US Treasury yield has touched a high of 5%.
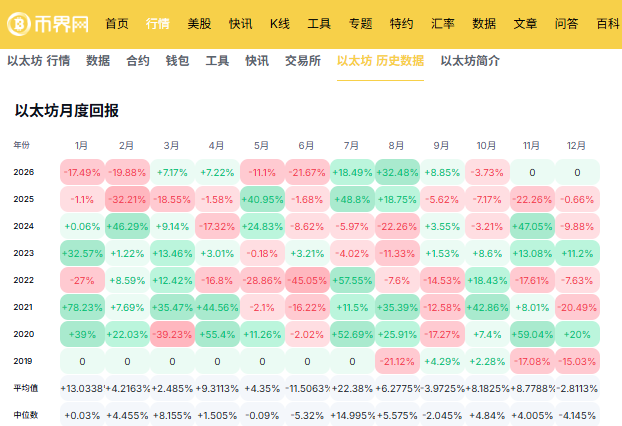
Image: Ethereum Monthly Returns
According to CoinMeta Ethereum returns, from 2019 to 2025, October saw declines only two or three times, with most years performing strongly. In October 2026, the current return is -3.73%, significantly below the historical average of +8.18%. This phenomenon of "peak season not peaking" is precisely the embodiment of the article's core contradiction.
In our view, as a high-beta asset more sensitive to liquidity, Ethereum typically faces greater selling pressure than Bitcoin when the interest rate environment tightens.
Ethereum Inflation Pressure
As Ethereum's staking rate has risen from near zero in early 2021 to over 35% today, ETH's issuance structure has undergone a fundamental change. Some analyses point out that if staking increases from 43 million to 60 million while the burn rate remains at current levels, annual issuance would rise from 1.09 million to 1.29 million, and the inflation rate would easily exceed 1%. The validator reward burn proposal in EIP-8363 has been removed from the Hegota update. In our view, Ethereum currently lacks effective supply-side policy tools to hedge the inflationary pressure brought by a rising staking rate.
Ethereum October Price Outlook: The Battle for $2,500
The $2,500 Dividing Line
Looking at on-chain data, we find that a considerable number of short positions are stacked near $2,500. You can think of it as the midline of a tug-of-war rope: if ETH can clearly stand above it and stabilize, shorts may be forced to close and cover, giving the price a chance to quickly reach the $3,000 area. Conversely, if the daily close falls below $2,500, the next key support would be the weekly swing point near $2,100. This level is not drawn arbitrarily; it is the dividing line for the shift in bullish and bearish forces.
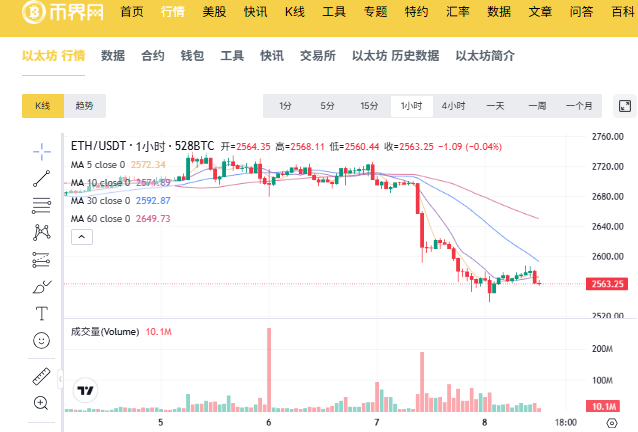
Image: Ethereum Candlestick Chart
October Price Trigger Conditions
From a trading perspective, we believe investors should really watch the switches for the two scenarios, rather than a single prediction of "$5,000 or $2,500." The upside scenario requires three conditions to be met simultaneously: the Glamsterdam upgrade proceeds as planned, mainnet fees substantially decline, ETF weekly net inflows remain above $100 million, and Bitcoin holds above $85,000. The downside scenario is more direct: the Fed releases further hawkish signals, L2 value leakage accelerates, or inflation expectations rise after the staking rate breaks above 40%.
Our View
In our view, the battle for $2,500 in October is, at a deeper level, about whether Ethereum can turn the prosperity of L2 into value that the mainnet and ETH holders can actually capture. If L2 transactions increase but fees and value remain in L2 and do not return to the mainnet, ETH lacks the fuel to challenge $5,000, and the risk of falling back to $2,500 will instead amplify. Conversely, if the Glamsterdam upgrade can lower mainnet fees and pull value back, ETH will have the confidence to challenge $5,000. Passing this test makes $5,000 meaningful; failing it makes $2,500 the defense line.
Ethereum October Price FAQ
Will Ethereum definitely rise to $5,000 in October 2026?
Not necessarily. Whether it can challenge $5,000 depends on simultaneous conditions such as ETF inflows, the Glamsterdam upgrade, and Bitcoin's trend. In our view, ETH is currently around $2,565, still nearly doubling away from $5,000.

Will Ethereum fall back to $2,500 in October 2026?
It is possible. $2,500 is a key technical dividing line. If the daily chart continues to close below it, ETFs turn to net outflows, and the Fed releases hawkish signals, ETH may test $2,100. But if it holds $2,500 and triggers short covering, the price could also rebound above $3,000.
Should I buy Ethereum now based on the $5,000 target?
You should not make decisions based solely on a target price. The $5,000 scenario requires ETF weekly net inflows above $100 million, the Glamsterdam upgrade to land, and Bitcoin to hold above $85,000. In our view, if these conditions are missing, the $2,500 support may be tested first.
Conclusion
In our view, Ethereum's price direction in October 2026 is not about guessing whether $5,000 or $2,500 will definitely be reached, but about identifying trigger conditions. If ETF weekly net inflows exceed $100 million, the Glamsterdam upgrade lands, and Bitcoin holds above $85,000, the bullish logic for challenging $5,000 will strengthen. If the daily chart breaks below $2,500 and L2 value leakage accelerates, the risk of falling back to $2,500 or even testing $2,100 rises. The battle for $2,500 is the key anchor for judging ETH's direction.
Disclaimer: Readers are strictly advised to comply with local laws and regulations. This article is compiled based on public market data for reference and educational purposes only, and does not constitute investment advice. Follow CoinMeta for the latest updates.