Newsletter
Bitcoin today fell to 81,749.83 US dollars at one point, breaking below yesterday's support level of 82,776.30 US dollars, and is currently trading around 82,486 US dollars.
On October 7th, spot Bitcoin ETF saw a net outflow of $484.9 million, marking the worst single-day performance since June; among the $429 million positions that were liquidated in the past 24 hours, 87.5% were long positions.
“Uptober” currently looks a bit red, but from the charts, it seems there is still some way to go before Bitcoin becomes truly “scary.”
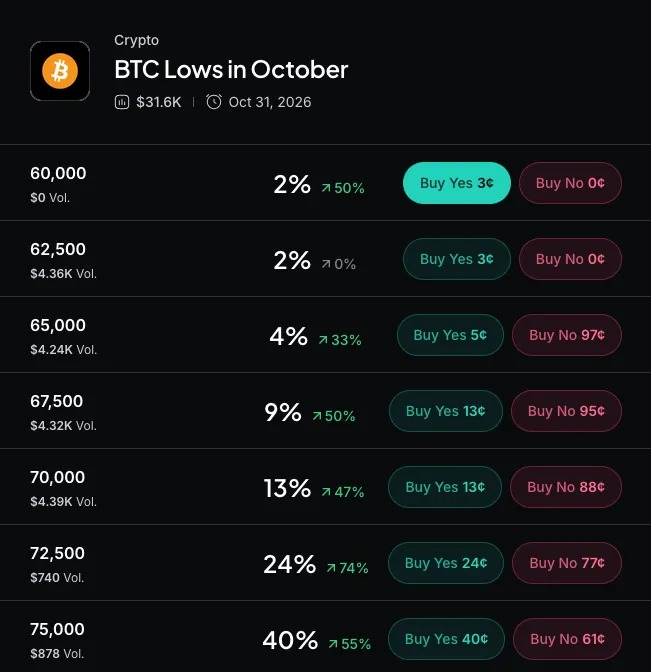
In the crypto community, October is usually referred to as “Uptober”, which is traditionally the month when Bitcoin brings the greatest gains for investors. However, it seems that the crypto market is ready to rewrite this convention once again.
Bitcoin continued to decline today, with a loss of 2.67% in the past 24 hours, reaching $81,125, which almost wiped out half of the gains this crypto asset made in September. The market trend is largely contrary to the usually reliable historical patterns: first there's the "red September," followed by " Uptober "; ironically, the same abnormal trend occurred last year as well.
Regarding the potential reasons for the recent weakness of Bitcoin, BTC is currently facing an unfavorable macroeconomic backdrop.
On Wednesday, Wall Street fell from record highs, Brent crude oil hovered around $100 per barrel, and the yield on U.S. Treasury bonds remained near its highest levels since 2002. Meanwhile, the latest minutes from the Federal Reserve meeting indicate that most officials expect another interest rate hike before the end of the year.
These headwinds have been putting pressure on Bitcoin for some time now. Yesterday, the decline of BTC continued to slow down, but it did not stop. Bitcoin weakened in tandem with stocks and gold during the decline, yet the daily chart still indicates a bullish trend, while the four-hour chart shows a bearish outlook.
This kind of differentiation still exists today.
Bitcoin Price: The daily trend is still present, but the buffer space has become smaller.
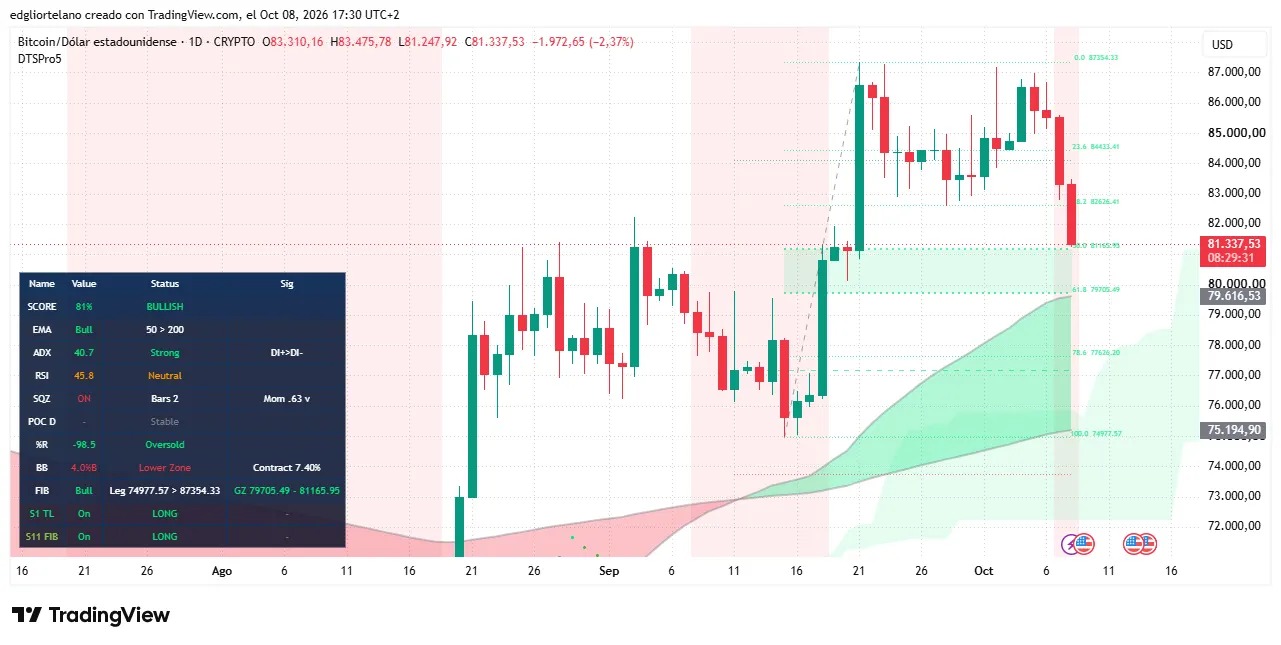
The daily candlestick chart opened at $83,310.16 today, but failed to rise further, reaching a high of only $83,475.78 before falling back to a low of around $81,337, a decrease of 2.37%. This low point broke below yesterday's support level of $82,776.30 and caused BTC to fall below the short-term price range of $82,626.41.
After reaching a high of $87,354.33 on September 21, Bitcoin has been trading sideways between $83,000 and $87,000 for over two weeks, and is now about 5.6% lower than that high.
The Average Directional Index ( ADX ) is used to measure the strength of a trend. Regardless of the direction, a reading above 25 generally confirms a trend. The current daily ADX is 40.7, which is lower than yesterday's 42.8; the buying pressure (+ DI ) is still higher than the selling pressure (- DI ), but the bullish sentiment is slowly cooling down.
The 50-day exponential moving average ( EMA ) is still higher than the 200-day EMA , and traders generally consider this to indicate that the long-term upward trend is still intact. The "golden cross" in the daily trend – one of the most typical bullish signals in technical analysis – is still valid, but it has begun to decline on the intraday time frame, and Bitcoin is also approaching the EMA200 line.
The momentum is weaker than what the trend strength indicates. The Relative Strength Index ( RSI ) has dropped from 52.5 yesterday to 45.8, slightly below the 50-point dividing line that separates bullish from bearish momentum. The Squeeze Momentum Indicator is still in an active state, which means volatility is compressed, like a coiled spring waiting for greater fluctuations.
According to the ETF capital flow data from Decrypt, on October 7th, spot Bitcoin had a net outflow of $484.9 million, which was the worst single-day performance since June. The single-day outflow nearly wiped out about 81% of the $595.3 million that had flowed in during the previous 9 trading days, and reduced the net inflow on the 10th to $110.4 million. The cumulative net inflow remains at $57.8 billion, so this is more of a setback rather than a major withdrawal of funds.
Leverage has amplified this wave of volatility. According to CoinGlass data, approximately $429 million in positions were liquidated over the past 24 hours, of which 87.5% were long positions. Liquidation refers to the exchange forcibly closing leveraged trades that can no longer cover their losses, and such forced sales will further push down prices.
Among them, Bitcoin accounted for $135.51 million, Ethereum accounted for $96.14 million, and nearly half of the total settlement amount—$202.24 million—occurred within the last four hours. This is lower than yesterday's $969 million, but it also indicates that long positions are still being continuously liquidated.
What to focus on next
If the daily close falls below $82,626.41, it will confirm the loss of support and the continuation of a short-term bearish correction; if the level is regained, the multi-week range will be maintained.
Below is the "golden range" of $81,165.95 to $79,705.49; pullbacks during an upward trend often attract buying interest in this area. The upper edge of the daily trend line is at $79,661.95, which is only about $44 away from the lower edge of this range.
Next notable catalysts to watch include news related to crude oil and shipping through the Strait of Hormuz, U.S. Treasury yields, daily ETF capital flows, as well as the Federal Reserve meeting on October 27th to 28th – at which time a rate hike seems unlikely.