Chipotle Mexican Grill ( CMG ) The stock price closed at $32.68 on Thursday, up 6.21% from $30.77 on the previous trading day.
The daily line RSI14 is at 46.98, which is below the neutral level of 50; the daily line MACD bar chart shows -0.03. The stock price is still below the 20-day exponential moving average of $32.74, the 50-day moving average of $33.72, and the 200-day moving average of $35.39.
On the hourly chart, RSI14 is at 64.8, which is higher than 50; on the hourly chart, the MACD bar chart shows 0.24. The daily average true range indicator ATR14 is 1.26 dollars, which is higher than the previous candlestick's 1.13 dollars.
On Thursday, October 8, 2026, CMG opened at $30.68, hit a low of $30.46 during the session, and closed at $32.68; the previous trading day's close was $30.77 on October 7. The trading volume for that day was 71,969,000 shares. Prices and technical indicators are provided by Twelve Data.
Chipotle Mexican Grill Stock Price: Daily resistance remains the main obstacle
The article states that the daily chart remains bearish: The closing price on Thursday was below the moving averages of three daily charts, with the shortest-term moving average being not far above the closing price. This proximity implies a direct test in the short term, but the overall structure still points downward.
Daily Moving Average Structure
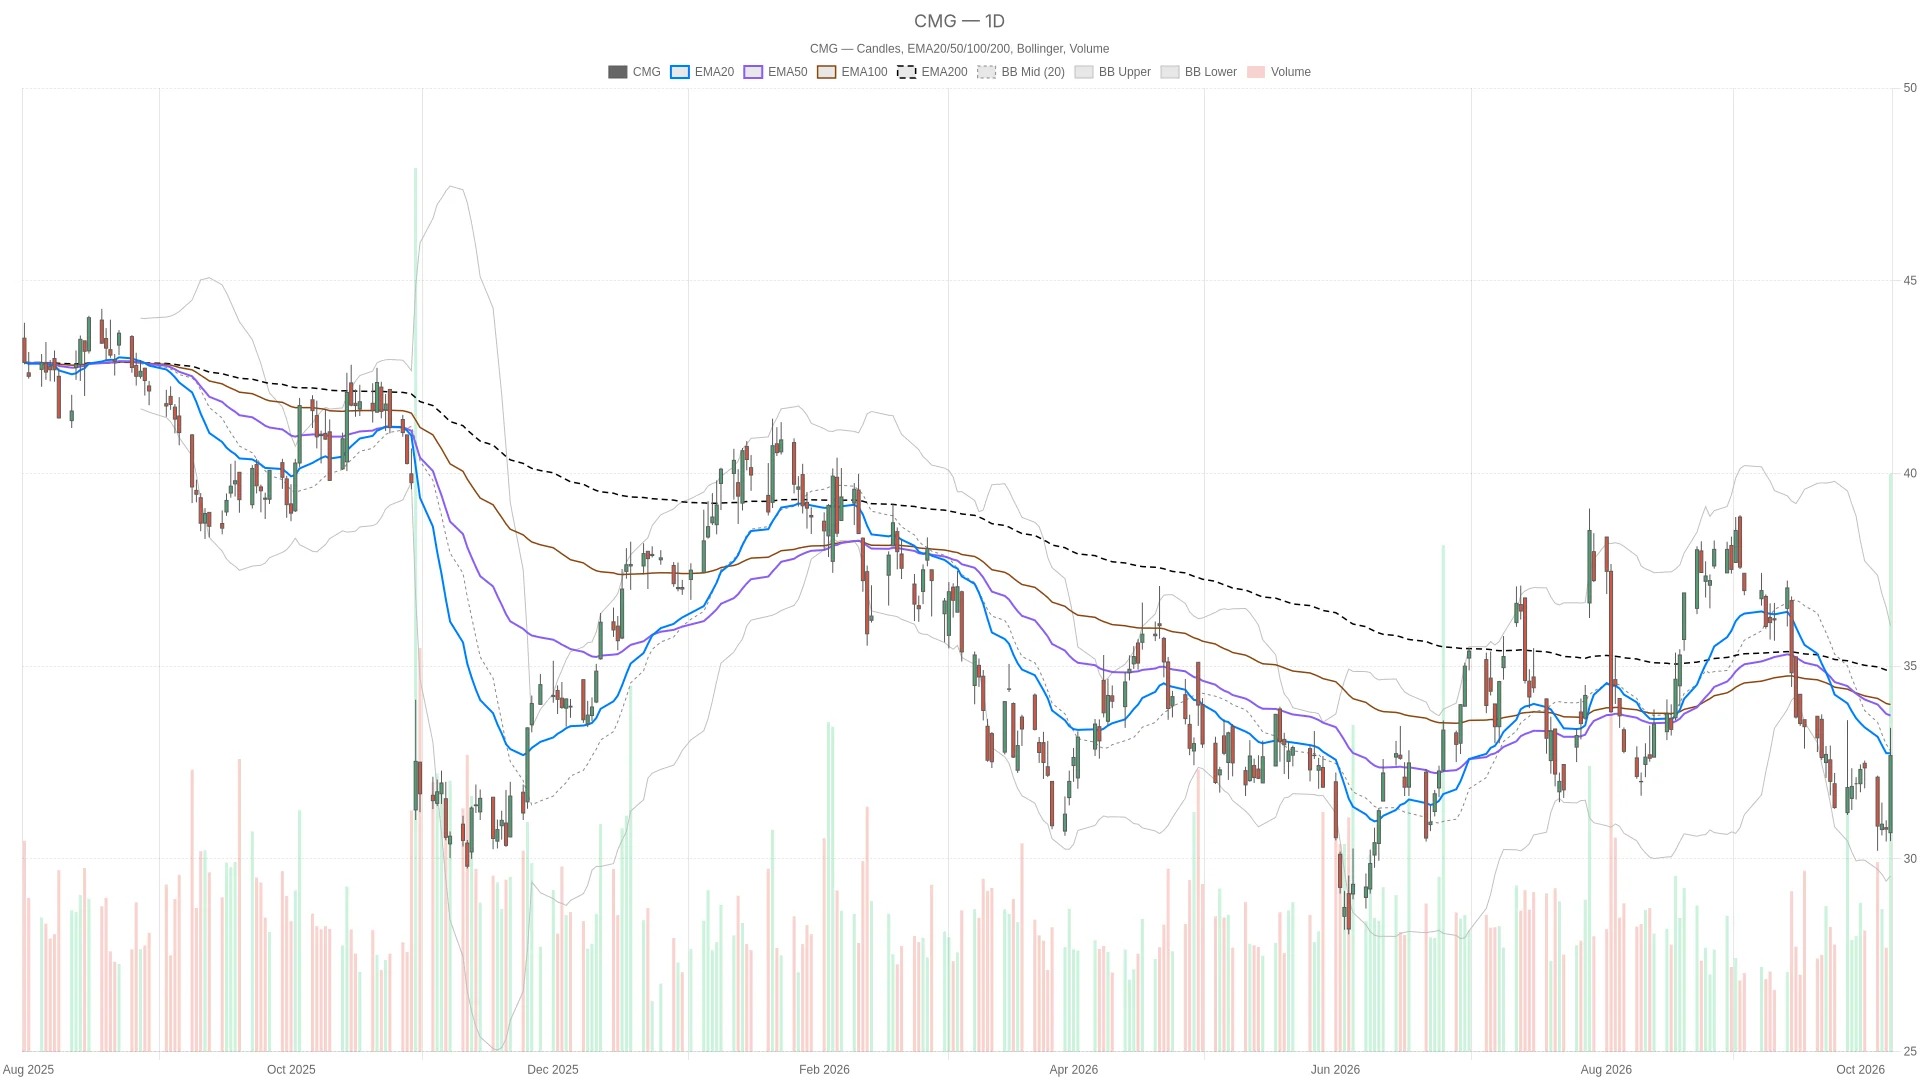
The daily moving averages are in a bearish arrangement: the stock price is below the 20-day EMA of $32.74; above that are the 50-day EMA of $33.72 and the 200-day EMA of $35.39. The shorter-term moving averages are closer together, making $32.74 the current testing level. However, merely breaking through this level does not change the broader bearish structure.
Daily Line Momentum, Volatility, and Pivot Points
The daily line RSI14 shows a value of 46.98, which is below the neutral threshold of 50. The MACD line is at -1, which is also below the signal line of -0.97, and the bar chart indicates -0.03. Neither indicator confirms a bullish trend on a daily basis; however, the MACD line is quite close to the signal line.
The middle band of the daily Bollinger Bands is at $32.8, which is also above the stock price, reinforcing the resistance area in that vicinity. The lower band of the Bollinger Bands is at $29.56, and the upper band is at $36.05. Meanwhile, the daily ATR14 has risen to $1.26, higher than the $1.13 of the previous candlestick, indicating a larger trading range.
For the next trading day, the daily pivot point is at $32.18, the first resistance level is at $33.9, and the first support level is at $30.96. The stock price is above this pivot point, providing a relatively positive reference point within the overall bearish daily chart structure.
CMG The strength of the hourly chart conflicts with the trend of the daily chart.
Hourly Moving Average and Momentum
The stock price is above the 20-hour EMA of $31.88 and the 50-hour EMA of $31.78, but still below the 200-hour EMA of $33.29. Both the 20-hour and 50-hour EMA are below the stock price.
The hourly chart RSI14 shows a value of 64.8, which is above 50 but has not yet entered the overbought zone. The hourly chart MACD line is at 0.4, which is 0.16 higher than the signal line, forming a positive bar chart with a height of 0.24.
Hourly chart range and pivot point
Short-term timing and acquisition reports
The signals at the execution points indicated by the 15-minute chart are rather mixed, while during the trading session on Thursday, multiple media outlets reported on the potential acquisition surrounding Chipotle Mexican Grill. In the shortest time frame, neither technical analysis nor news developments provided a clear directional advantage.
15-minute Technical Analysis
The stock price is flat at $32.68 for the 20-period EMA, which is higher than the 50-period and 200-period EMA values of $32.08 and $31.69, respectively. The RSI14 value is 53.84, also higher than the 50-period value. However, the MACD line is 0.3 lower than the signal line, which is 0.4, and the bar chart shows a value of -0.1.
Background of the Acquisition Report
During the trading session on Thursday, Yahoo Finance reported that The Financial Times mentioned that Starbucks had explored potential acquisitions of Chipotle. According to another report from Investing.com, surrounding these acquisition rumors, the activity in Chipotle option trading soared, with the bullish/bearish option ratio reaching 7.6 times.
A report released by Seeking Alpha after the close on Thursday also mentioned acquisition explorations. On Friday, October 9th, Yahoo Finance reported that retail investors' sentiment towards Chipotle had reached an annual high, but that report was not published during the trading hours on Thursday. Exploration does not equate to a transaction that has been concluded or completed.
CMG Bull and Bear Scenarios
The next move for the stock price of Chipotle Mexican Grill depends on whether it can break through the resistance range between $32.74 and $32.80.
Bullish scenario
A bullish scenario requires the stock price to break through the 20-day EMA of $32.74, as well as to stand above the middle band of the Bollinger Bands at $32.8. If these levels can be maintained, it will help to challenge the 50-day EMA of $33.72. The first resistance level on the daily chart for the next trading day is at $33.9. If the daily RSI returns above $50, and the MACD line is higher than the signal line, this scenario will be further strengthened.
Bearish scenario
On the contrary, if it falls below the first support level of $32.39 on the hourly chart of the next trading day, it will weaken the evidence for a short-term bullish outlook. Below that is the daily pivot point of $32.18, followed by the first daily support level of $30.96. If these levels are lost, the near-term bullish scenario will become invalid. The intraday low of $30.46 and the lower band of the daily chart at $29.56 can be used as further references.
Overall, CMG is positioned above the pivot point of the next trading day's daily chart, but it is still below the nearby daily moving averages and the resistance of the Bollinger Bands. The daily ATR14 level is at $1.26, reflecting the current volatility context. The unresolved question is whether the positive readings on the hourly chart will be sufficient to support a breakout above the daily resistance. The mixed short-term signals, coupled with the unconfirmed acquisition explorations, make this judgment even more complex.
Frequently Asked Questions
What is the daily technical structure of the Chipotle Mexican Grill stock price?
CMG closed at $32.68 on Thursday, below the moving averages of three daily charts. The 20-day EMA is at $32.74, the 50-day EMA is at $33.72, and the 200-day EMA is at $35.39. The daily RSI14 is at $46.98, which is below the neutral 50 threshold, and the daily MACD bar chart shows -0.03. The daily ATR14 is at $1.26, indicating the measured trading range.
What does the hourly chart indicator for CMG show?
The hourly chart presents a more positive outlook. The stock price is above the 20-hour EMA of $31.88 and the 50-hour EMA of $31.78. The hourly chart RSI14 shows a value of 64.8, which is higher than 50, and the bar chart on the hourly chart MACD shows 0.24. However, the stock price is still below the 200-hour EMA of $33.29, while it remains above both the 20-hour and 50-hour EMA.
What key resistance and support levels need to be watched out for?
The current daily resistance levels are at the 20-day EMA of $32.74 and the middle band of the Bollinger Bands at $32.8. Above that are the 50-day EMA of $33.72 and the first daily resistance level for the next trading day at $33.9. On the downside, the first support level on the hourly chart for the next trading day is at $32.39, followed by the daily pivot point at $32.18 and the first daily support level at $30.96.
During the trading session on Thursday, Yahoo Finance reported that The Financial Times mentioned that Starbucks had explored potential acquisitions of Chipotle. Investing.com also noted that around these acquisition reports, the activity in Chipotle option trading soared, with the bullish/bearish option ratio reaching 7.6 times. A report released by Seeking Alpha after the close on Thursday also mentioned the exploration of acquisitions. However, exploration does not equate to a transaction that has been concluded or completed.
Cryptonomist and the author do not hold any positions in the financial instruments mentioned in this text, nor have they received any compensation from the companies reported.
This article was generated with the assistance of artificial intelligence and has been reviewed by an editorial team.