ASML Holding The stock price maintains a bullish structure on the daily chart, but this has not been confirmed on the hourly chart. At the close on Friday, the stock price was above three daily moving averages, however, the price levels on shorter time frames were less favorable. The core issue is whether the daily support level can be held once the price breaks through the upper hourly moving average.
Key Points
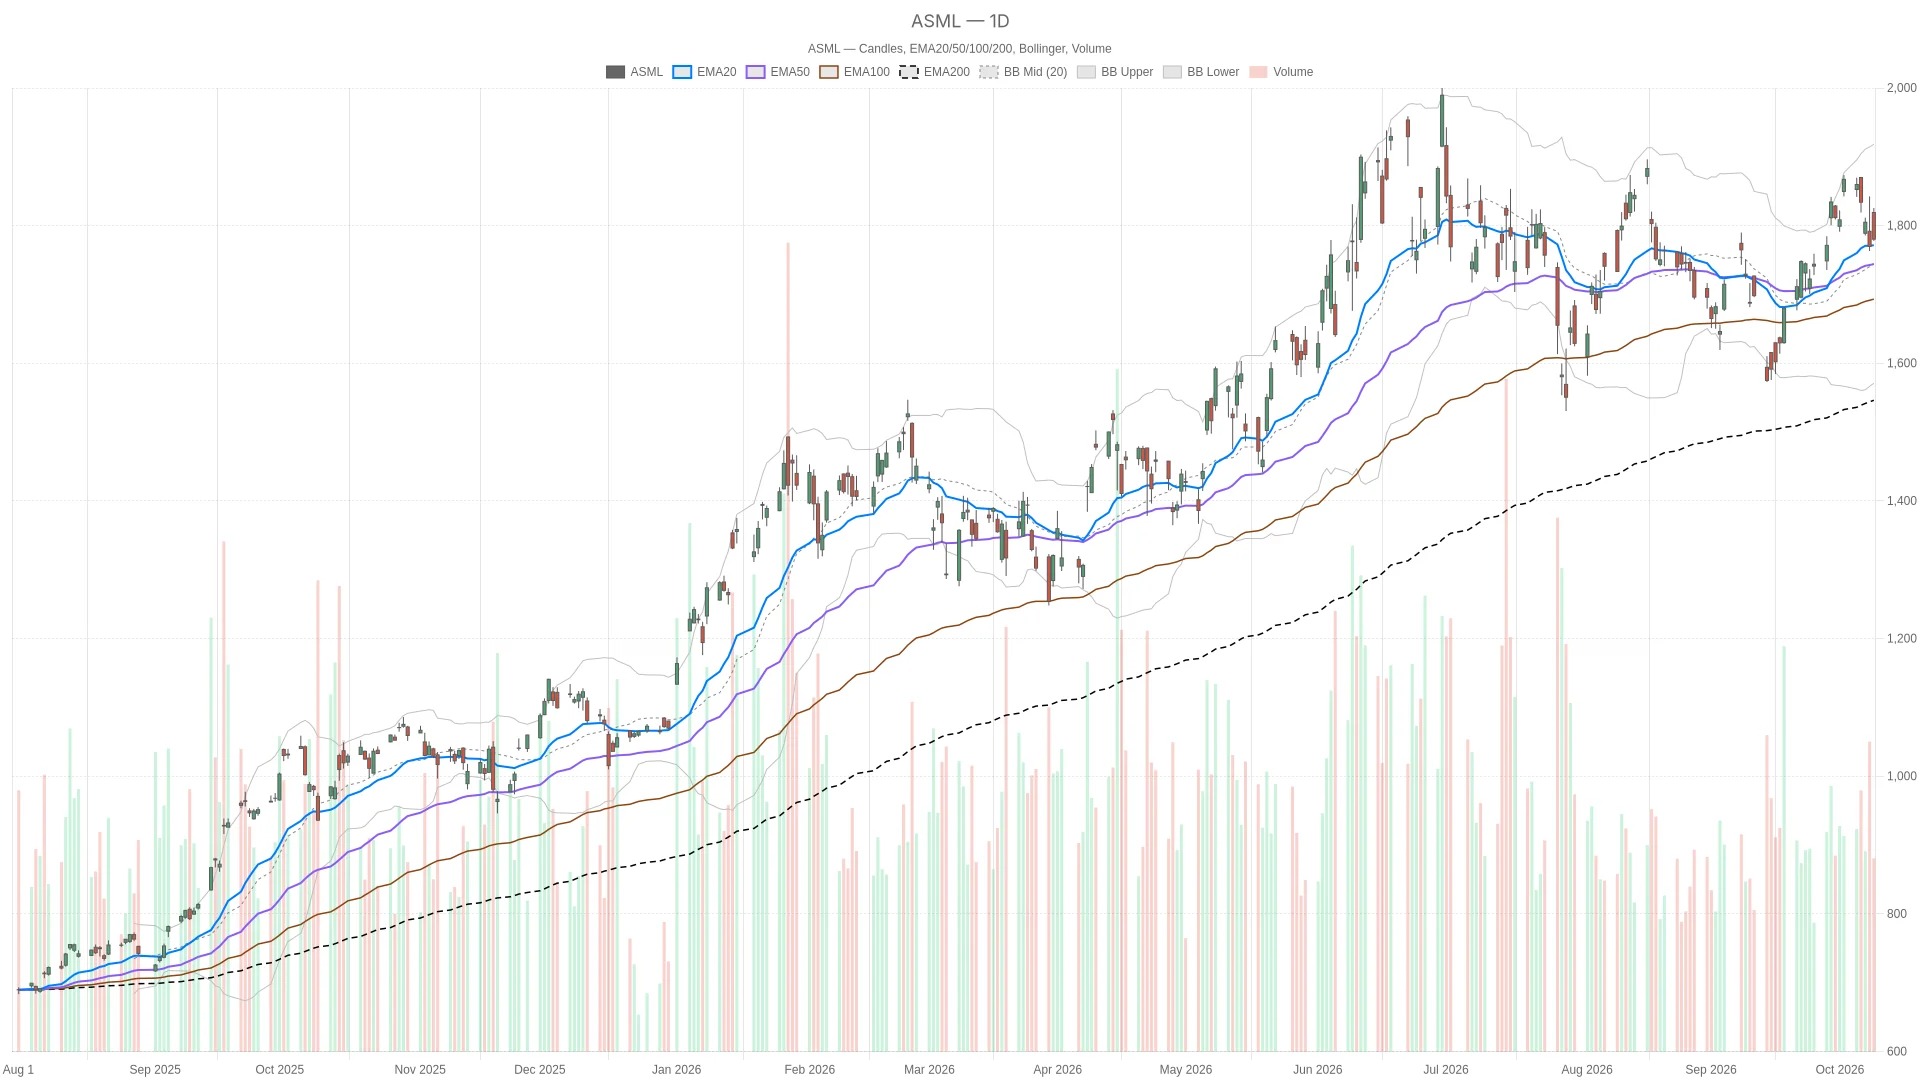
- ASML closed at $1,780.34 on Friday, October 9, 2026, which is higher than the 20-day moving average of $1,771.59, the 50-day moving average of $1,744.24, and the 200-day moving average of $1,549.15.
- The daily line RSI14 is at 52.44, which is above the neutral level; the MACD bar chart shows a value of 2.67, which is lower than the 6.37 on October 8th.
- The hourly line RSI14 is at 42.41, which is below the neutral value of 50, while the MACD bar chart shows -0.24.
- The closing price was below the daily pivot point of $1,794.64 for the next trading day, as well as below the 20-period EMA of $1,795.45 and the 50-period EMA of $1,803.73 on the hourly chart.
- The daily line ATR14 is at $51.83; the first resistance level on the daily chart is $1811.27, and the first support level is $1763.70.
On Friday, October 9, 2026, ASML opened at $1819.14, hit a low of $1778.00 during the session, and closed at $1780.34, up 0.6% from the previous closing price of $1769.79. Although the closing price was lower than the opening price, the stock still rose on the day. The prices and technical indicators are provided by Twelve Data.
ASML Holding Stock price still maintains a bullish structure on the daily chart
The closing price was above the 20-period EMA at $1771.59, the 50-period EMA at $1744.24, and the 200-period EMA at $1549.15. The price arrangement is bullish in relation to these moving averages. The closing price is also higher than the daily low of $1778 and above the 20-period moving average of $1771.59, which is a crucial factor for a bullish outlook.
At the same time, the daily line RSI14 is at 52.44, which is above neutral but has not entered the overbought zone. The MACD line is at 26.47, higher than the signal line of 23.81, and the bar chart shows a positive value of 2.67. However, the bar chart value has decreased from 6.37 on October 8th to 2.67. Therefore, the daily momentum is still slightly positive, but it does not provide full support.
The middle band of the daily Bollinger Bands is at $1,744.55, which is below the closing price. The upper band is at $1,918.16, and the lower band is at $1,570.94. The price is above the middle band but has not yet touched the upper band. The daily ATR14 indicator is at $51.83, providing more reference for volatility rather than directional signals. After trading resumes, the pivot point for the next trading day will be at $1,794.64, with the first resistance level at $1,811.27 and the first support level at $1,763.70.
The weakening of the hourly chart complicates the analysis on the daily chart.
In contrast, the closing price is lower than the 20-period EMA at 1795.45 USD and the 50-period EMA at 1803.73 USD, but still higher than the 200-period EMA at 1770.71 USD. The hourly line RSI14 is at 42.41, which is below the neutral level; the MACD line is at -12.19, which is also below the signal line of -11.95. A bar chart with a value of -0.24 confirms this negative relationship.
The closing price was also below the middle band of the hourly Bollinger Bands at $1,794.32, but above the lower band at $1,756.62. The upper band is at $1,832.02. Overall, the closing price fell within the lower half of the hourly range. For the next trading day, the pivot point on the hourly chart is set at $1,781.81, with the first resistance level at $1,785.63 and the first support level at $1,777.63.
The 15-minute chart provides a reference at the execution level.
From an execution perspective, the 15-minute chart shows a slightly bearish arrangement. The closing price is below the 20-period EMA at $1783.68, the 50-period EMA at $1790.95, and the 200-period EMA at $1802.76. The RSI14 value is 44.69, which is below the neutral level. However, the MACD line is at -2.36, which is higher than the signal line of -2.79, resulting in a positive bar chart of 0.43. This slightly positive reading does not offset the conflict between the daily and hourly charts. For the next trading day, the 15-minute pivot point is set at $1780.93, with the first resistance level at $1783.86 and the first support level at $1778.51.
Financial report coverage provides context for the uncertainties associated with ASML.
Meanwhile, a report released by Yahoo Finance during the trading session on Friday mentioned that ASML benefits from demand driven by artificial intelligence and strategic cooperation, but also faces valuation premiums and policy risks. Seeking Alpha's financial forecast released during the trading session suggested that high expectations might be reasonable, based on storage demand and expenditures on advanced logic chips. These are editorial judgments and cannot be confirmed by charts.
Another report published by Yahoo Finance after the close on Friday mentioned the financial results for October 14th and questioned the valuation of ASML. Since this report was released after the trading session of that day had ended, it should not be considered an explanation for the price movements of that day.
ASML Holding Bull and Bear Scenarios for Stock Prices
The bullish scenario requires that the stock price of ASML Holding hold above the 20-day moving average of $1771.59 on the daily chart. If it can break through the pivot point of $1794.64 on the next trading day, this judgment will be strengthened. Above that, the hourly moving averages of $1795.45 and $1803.73 represent further resistance levels, followed by the first daily resistance level of $1811.27. If it can remain above these levels, it will provide the confirmation on the hourly chart that is currently lacking.
On the contrary, if it falls below the 20-day moving average of $1771.59 on the daily chart, the bullish outlook will weaken. Next is the 200-day moving average of $1770.71 on the hourly chart, followed by the first support level of $1763.70 on the daily chart. If it continues to fall below this support level, the short-term bullish scenario will no longer hold. At that point, the middle band of the daily Bollinger Bands at $1744.55 and the 50-day moving average of $1744.24 will become the next lower reference levels.
Overall, ASML is above the daily trend support level, but below the next trading day's daily pivot point and key hourly moving averages. The daily ATR14 level is at $51.83, which makes the fluctuations in this area still worth monitoring. The unresolved question is whether the hourly resistance level can be broken through without damaging the daily support structure.
Frequently Asked Questions
What was the closing price of ASML on Friday, October 9th?
ASML closed at $1780.34, up 0.6% from the previous close. The trading range for the day was from $1778 to $1825.57.
What does the daily chart show?
The closing price is above the 20-period EMA of $1,771.59, the 50-period EMA of $1,744.24, and the 200-period EMA of $1,549.15. The daily line RSI14 is at 52.44, which is higher than the neutral level; the MACD line is above the signal line, and the bar chart shows a positive value of 2.67.
What are the key support and resistance levels?
The first support level on the daily chart is $1763.70, with nearby levels including the 20-day EMA at $1771.59 and the 200-day EMA at $1770.71 on the hourly chart. The first resistance level on the daily chart is $1811.27, followed by the pivot point of $1794.64 on the next trading day, as well as the hourly moving averages of $1795.45 and $1803.73, which form intermediate resistance levels.
What does the hourly chart show?
The closing price is below the 20-hour EMA of $1,795.45 and the 50-hour EMA of $1,803.73, but above the 200-hour EMA of $1,770.71. The hourly line RSI14 is at 42.41, which is below the neutral level, and the hourly line MACD bar chart shows -0.24.
Cryptonomist and the author do not hold any positions in the financial instruments mentioned in this text, nor have they received any compensation from the companies reported.
This article was generated with the assistance of artificial intelligence and has been reviewed by an editorial team.