

Key Points
- XRP traded around $1.374 on Tuesday after a callback from the previous day.
- XRP The long-short ratio is 1.09, indicating that the bulls are slightly in the lead.
- The immediate support level is at $1.339, followed by $1.300; resistance starts at $1.381.
XRP There was a slight rebound on Tuesday. After the pullback on the previous day, the positions in derivatives improved to some extent.
XRP traded at around $1.374, showing signs of stabilization. However, different funding rates indicate that traders still have disagreements regarding the strength of this rebound.
For XRP, the resistance of the moving average above and the weak momentum continue to limit its short-term prospects.
The long-short ratio is slightly on the high side.
CoinGlass data shows that on Tuesday, the long-to-short ratio of XRP was 1.09. A reading above 1 indicates that there are more long positions than short positions among the accounts or positions tracked by this indicator.
These data indicate that the market has a slightly bullish outlook on both assets. However, neither of these readings is sufficient to show strong confidence, and the positions held do not confirm that prices will continue to rise.
The funding rate for XRP turned negative on Monday, reaching -0.0055% on Tuesday. A negative funding rate means that shorts have to pay a fee to longs, indicating that despite a slightly positive long-to-short ratio, the market's demand for bearish positions continues.
XRP remains below the key moving average
Around $1.374, XRP is below its 200-day exponential moving average of $1.381, as well as below the 50-day EMA of $1.395.
These levels constitute the first resistance faced by the rebound. The token is still above the 100-day EMA of $1.339, providing support in that area, but it lies below two other moving averages, which indicates that the short-term outlook remains bearish.
The Relative Strength Index is close to 40, indicating that the buying momentum is weak, but it has not yet entered a clearly oversold area.
The Moving Average Convergence Divergence (MACD) indicator also remains negative, further reinforcing a cautious outlook.
If it can remain above $1.381 and $1.395, it will alleviate the current technical pressures.
In addition to these moving average resistances, the analysis also indicates that further horizontal resistance levels are at $1.671 and $1.900.
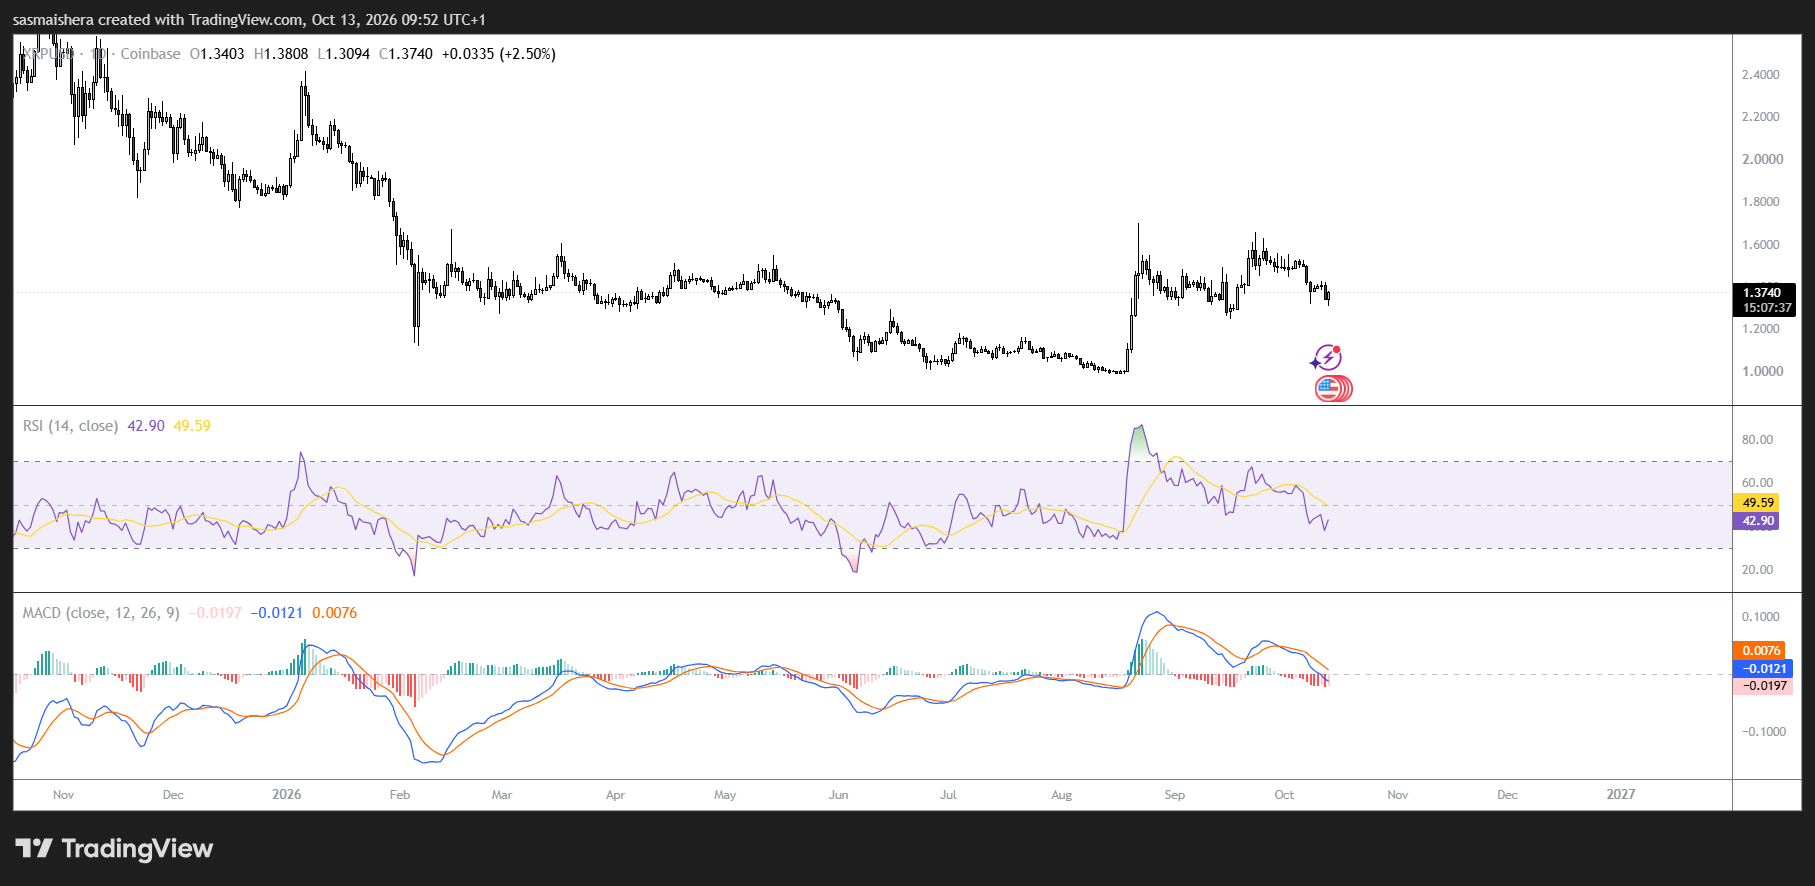
On the downside, $1.339 per 100 EMA is the first support level, followed by $1.300.
If it continues to fall below $1.300, it will weaken the rebound structure and bring the deeper support area around $1.000 into focus.
Currently, the improvement in derivative positions has brought some encouragement, but XRP still requires stronger price momentum to once again stand above the upper moving average.