

Key Points
- Dogecoin traded at around $0.084 on Tuesday, after rebounding from a intraday low of around $0.0800.
- After experiencing no net inflow last week, ETF, which focuses on DOGE, recorded a capital outflow of $399,460 on Monday.
- Resistance levels are at $0.0876 near the 50-day EMA and at $0.0923 near the 200-day EMA.
Dogecoin saw a slight increase on Tuesday, after testing $0.0800 earlier in the day, showing some signs of stabilization following a 5% decline on Monday.
DOGE traded at around $0.084, but the outflow of funds from ETF, the decrease in the concentration of coins held by large wallets, and weak technical momentum continue to dampen its prospects for a rebound.
The token is still below the key moving average, and the test for buyers is whether they can hold onto the nearby support levels.
Dogecoin ETF recorded nearly $400,000 in capital outflows
According to SoSoValue data, exchange-traded funds focused on DOGE recorded a net outflow of $399,460 on Monday.
In the previous week, there was no net inflow or outflow of such products, indicating that the demand entering through these investment products has weakened.
Redemption may weaken some of the buying support, although the daily capital flow is not sufficient to prove a lasting change in institutional sentiment.
These data themselves do not indicate where the withdrawn funds subsequently went.
Santiment data shows that wallets holding over 100 million DOGE account for 69.74% of the circulating supply, which is lower than the 70.02% on September 1st.
However, wallet classifications may include exchanges and other entities, and a decrease in their proportion does not necessarily mean that the related tokens have all been sold.
Combined with the capital outflow of ETF, these data make the outlook for short-term demand more cautious.
DOGE remains below the key moving average
Near $0.084, Dogecoin is below its 50-day exponential moving average of $0.0876, as well as below the 200-day EMA of $0.0923.
These levels constitute the main resistance zones identified in the analysis, and they also reinforce the short-term bearish structure.
The momentum indicator remains weak. The MACD indicator has fallen below the zero line, while the Relative Strength Index ( RSI ) is close to 39.
This reading of RSI indicates that the buying momentum is weak, but it is still above the 30 threshold which is generally considered to be oversold.
The current direct downward reference level is $0.0800, which corresponds to the low point on February 6th. If this level is confirmed to be broken through, the low point of $0.0683 on July 23rd may become the next focus.
This means a further decline of about 15% from that support level, or about 18% from the price of $0.0829 mentioned in the text.
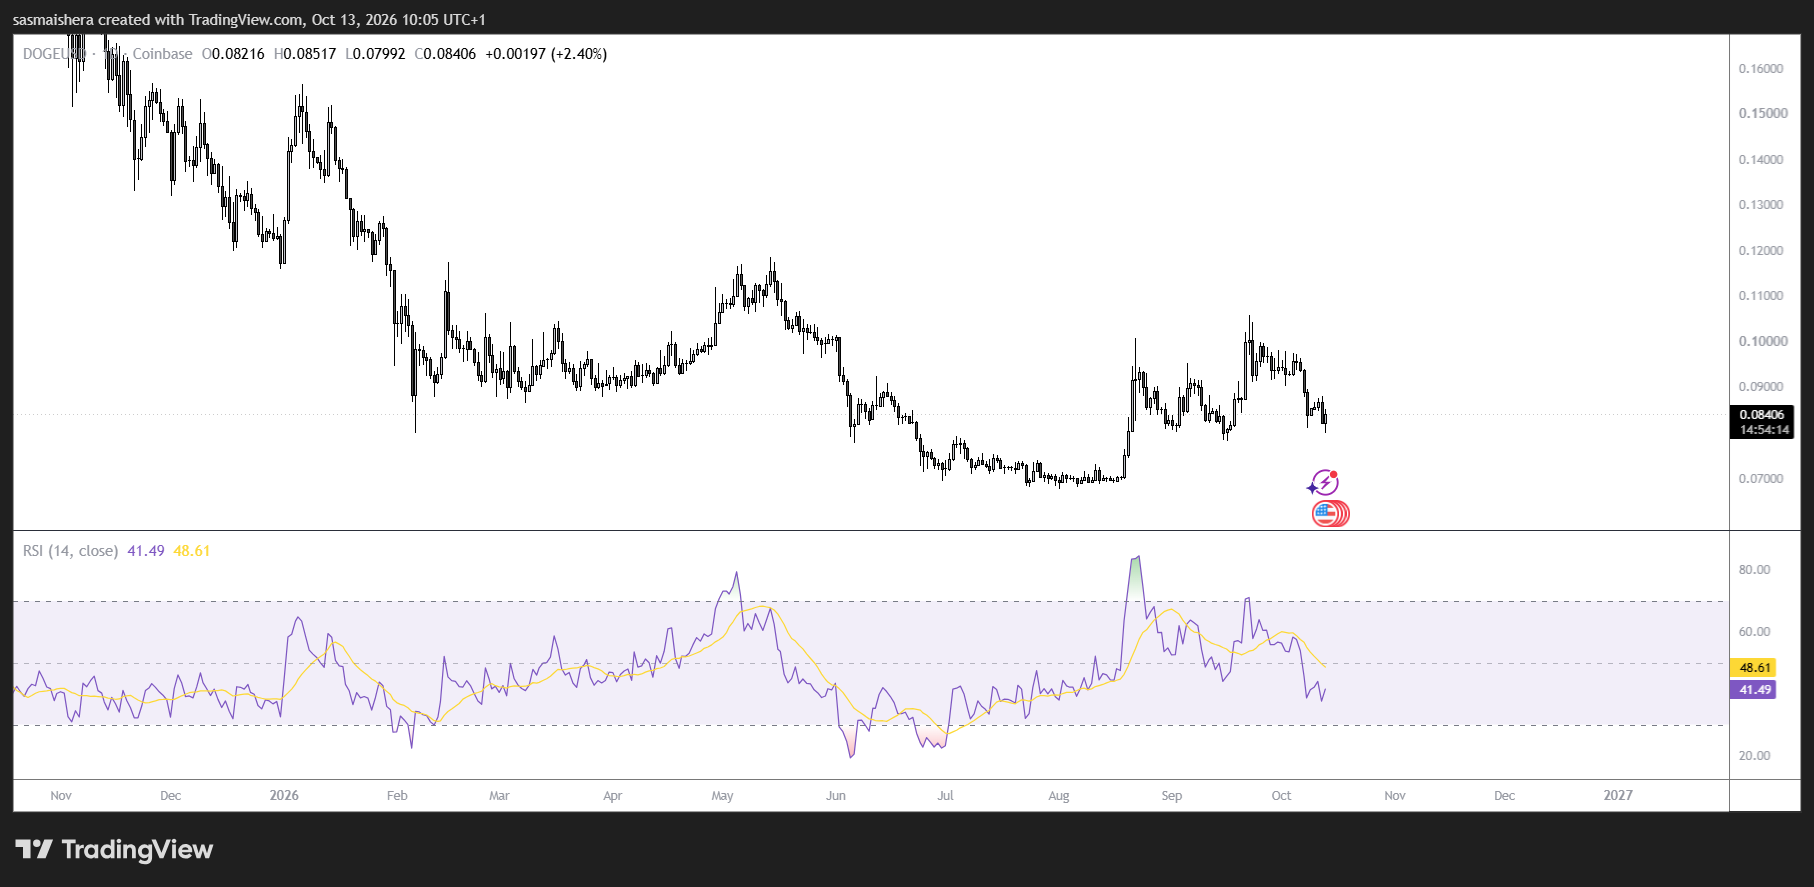
On the upside, if it can continue to rise and break above $0.0876, that would help to alleviate the current pressure. The next major resistance level will be the 200-day EMA near $0.0923.
For now, the rebound from $0.0800 indicates that buyers are holding onto the support level, but for a more sustained recovery to take place, there is still a need for stronger demand and improving momentum.