

Key Points
- On Friday, October 16th, the stock price of Disc Medicine closed at $56.84, which is lower than the $62.49 on the 20th, $67.96 on the 50th, and $70.5 on the 200th.
- The daily line RSI14 is at 25.29, which is in an oversold range; the daily line MACD has a value of -0.33, and the MACD line is at -4.07, which is below the signal line of -3.74.
- The hourly line RSI14 is at 44.32, which is below 50; the column value of the hourly line MACD is 0.14, and the line of MACD is -0.6, which is higher than the signal line of -0.74.
- Positive results from the third phase of the APOLLO trial regarding bitopertin were reported on Monday, October 19th, after the market closed on Friday.
- The daily pivot point for the next trading session is $56.36, with the first resistance level at $57.72 and the first support level at $55.48.
On Friday, October 16, 2026, IRON opened at $56.56, hit a low of $55.00 during the session, and closed at $56.84, up from the previous closing price of $56.65 by 0.34%. This indicates that the closing price for that trading day was above the nearby daily support level, but still below the moving average level that defines a broader bearish trend.
Disc Medicine Stock price faces a bearish daily chart structure

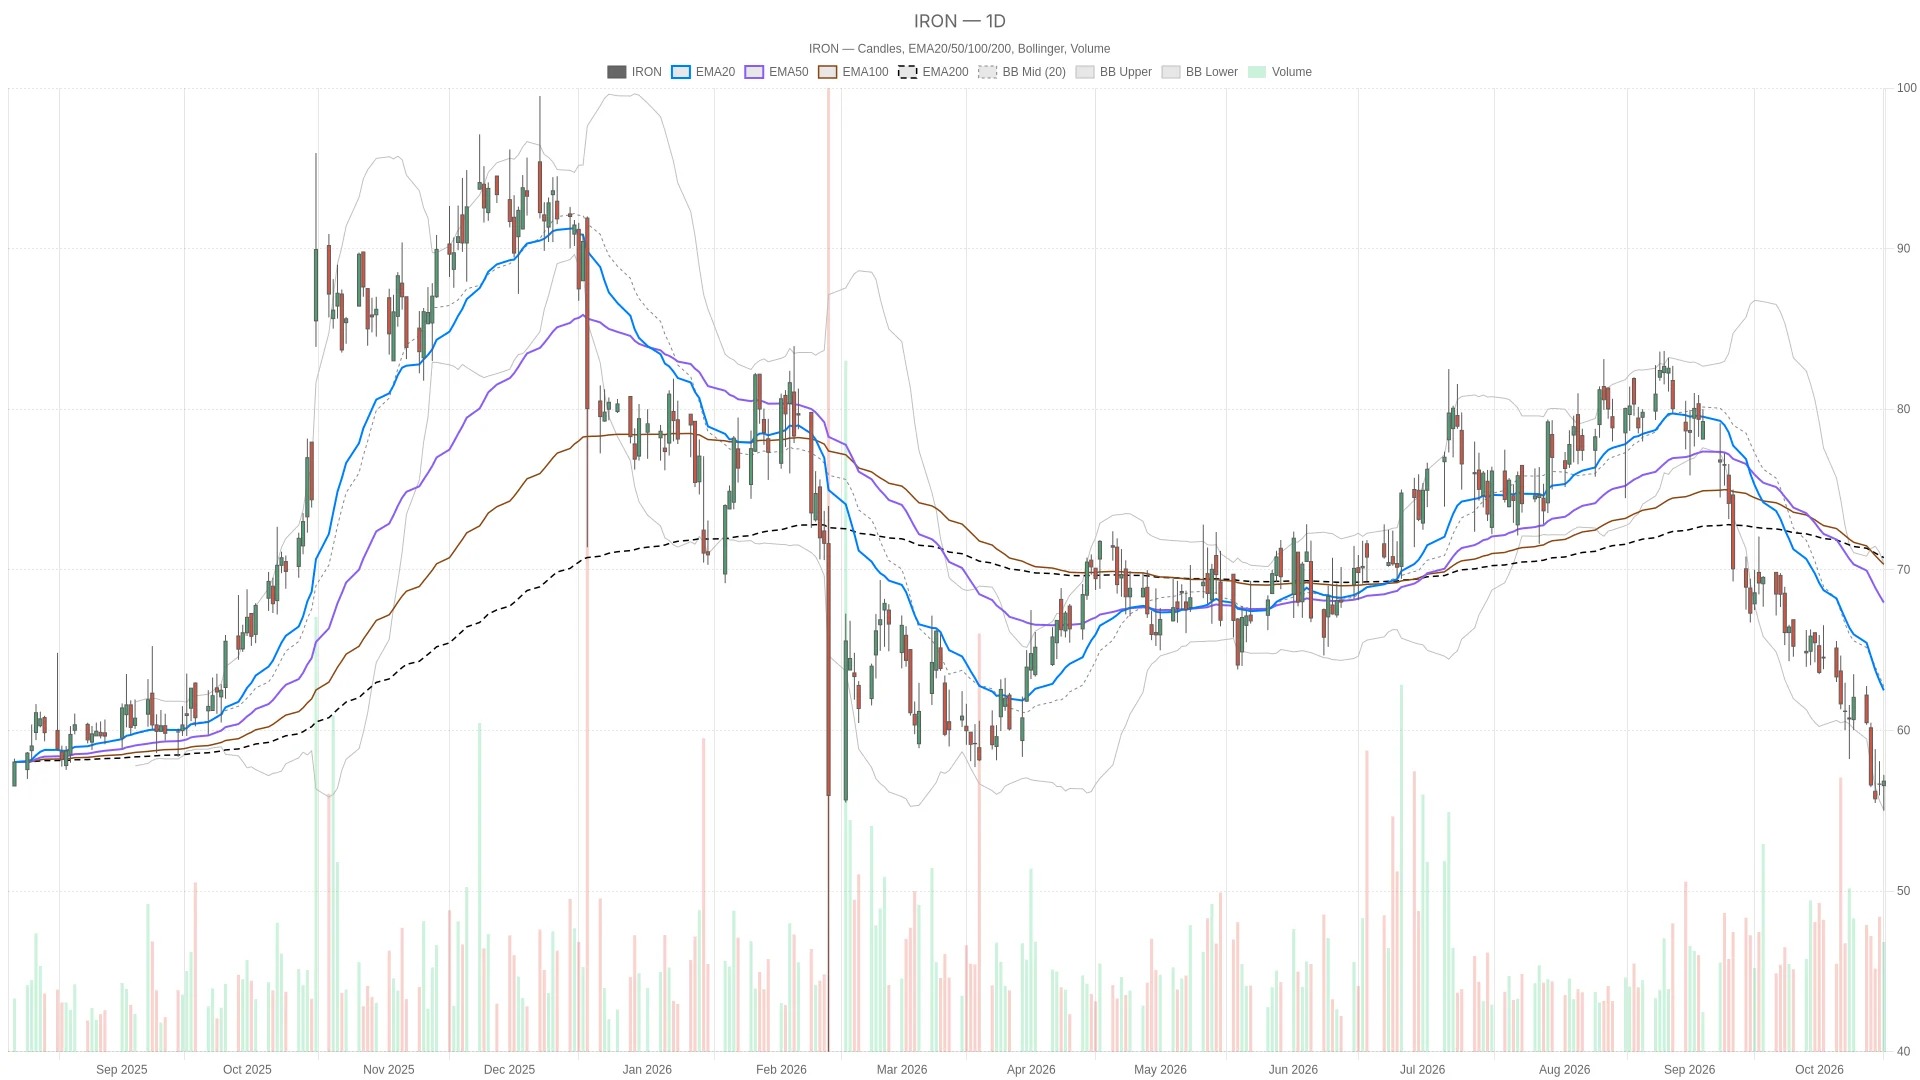
The daily moving averages are in a bearish arrangement. The stock price is below the 20-day EMA of $62.49, and further below the 50-day EMA of $67.96 and the 200-day EMA of $70.5. This arrangement supports a major bearish scenario. Even if the stock price breaks through the nearby resistance level, it is not sufficient to reverse this daily trend.
However, the daily line RSI14 is at 25.29, which is in an oversold range. The daily line MACD is at -4.07, below the signal line of -3.74, and the bar value is negative, at -0.33. These readings are not contradictory: RSI indicates an oversold state, while MACD supports a bearish judgment.
At the same time, the closing price was above the lower band of the daily Bollinger Bands at $55.04 and below the middle band at $62.72. The lower band seems to serve more as a near-term downward reference point rather than evidence of a bullish reversal. The daily ATR14 level of $2.87 provides a reference for volatility but does not indicate a direction.
Hourly chart confirms the overall judgment, but the momentum signals are inconsistent.
The hourly chart generally confirms the daily view. On Friday, the closing price was below the 20-period EMA of $57.04, the 50-period EMA of $58.63, and the 200-period EMA of $65.78 on the hourly chart. These moving averages are also in a bearish alignment, which is consistent with the bearish judgment on the daily chart.
However, the momentum signals on the hourly chart are not consistent. The value of RSI14 is 44.32, which is below 50, but the value of MACD line (-0.6) is higher than the signal line (-0.74). The bar value of MACD on the hourly chart is positive, at 0.14, yet the moving average structure remains bearish. The price is also above the middle band of the hourly chart's Bollinger Bands at $56.72, but below the upper band at $57.79.
15-minute chart shows a bias towards short-term trends
At the execution level, the 15-minute chart is not so pessimistic. The closing price is higher than the 20-period EMA of $56.6 and the 50-period EMA of $56.79, but lower than the 200-period EMA of $58.91. The RSI14 is at 53.99, which is higher than 50. The MACD line is at -0.02, which is higher than the signal line of -0.1, and the bar value is positive, at 0.08. These readings support a bullish short-term trend, but they do not imply a change in the daily-line logic.
Reports related to the experiment were released on Monday.
According to a report released on Monday, October 19th, Disc Medicine announced positive results from phase three trials of its EPP drug. Investing.com reported that driven by the positive results from phase three trials of a rare sun-related disease, the stock soared by 60%. The report was published on Monday, after the end of the full trading session on Friday.
Earlier reports on Monday mentioned that the market was awaiting the top-line results of the Phase III trial of bitopertin's APOLLO. Subsequent positive news reports provided an important context for the stock price of Disc Medicine. However, this information does not indicate where the stock price will be positioned during the next trading session relative to these technical levels.
Bullish and bearish conditions for the next trading session
For the next trading session, the daily pivot point is at $56.36, the first resistance level is at $57.72, and the first support level is at $55.48. A bullish scenario requires the stock price to hold above the pivot point and break through the first resistance level. If it can stay above $57.72, then the $62.49 target for the 20-day EMA and the middle band of the Bollinger Bands at $62.72 will become the next test.
On the contrary, if it falls below the daily pivot point of $56.36, that would weaken the bullish scenario. If the first support level of $55.48 is also breached, it would further undermine this outlook. At that point, the lower band of the daily Bollinger Bands at $55.04, as well as the low of $55 from Friday, would become the focus of attention.
Looking at the shorter-term rhythm after the trade recovery, the 15-minute pivot point is at $56.87. The first resistance level is $57.15, and the first support level is $56.61. The closing price on Friday was below this pivot point but above the first support level. These are reference points at the execution level and are of less importance than the daily chart structure.
Overall, the reference closing price for the completed trading period remains at $56.84, which is above the daily support level but below the bearish moving average settings on both the daily and hourly timeframes. The daily ATR14 level is at $2.87, which defines the range of fluctuations. Whether the performance on Monday can be sustained above this resistance level remains to be seen.
Frequently Asked Questions
Disc Medicine Where will the stock price close on Friday?
On Friday, October 16, 2026, the stock price of Disc Medicine closed at $56.84, with a trading range of $55 to $57.23. On that trading day, it rose by 0.34% compared to the previous closing price.
What does the daily moving average show?
The daily moving averages are in a bearish arrangement. The stock price is below the 20-day average of $62.49, the 50-day average of $67.96, and the 200-day average of $70.5. The closing price of $56.84 is still below these three moving averages.
What are the key pivot points for the next trading session?
The daily pivot point is $56.36, with the first resistance level at $57.72 and the first support level at $55.48. The 15-minute pivot point is $56.87, with the first resistance level at $57.15 and the first support level at $56.61. For a bullish scenario, it is necessary to hold the daily pivot point and break through the first resistance level.
What were the results of the three phases of trials reported on Monday?
Reports released on Monday, October 19th, stated that Disc Medicine announced positive results from Phase III trials of APOLLO for the treatment of EPP, a rare sun-related disease. According to Investing.com, driven by these results, the stock price soared by 60%. These reports were published after the end of the regular trading session on Friday.
Neither Cryptonomist nor the author holds any positions in the financial instruments mentioned in this text, nor have they received any compensation from the companies reported.
This article was generated with the assistance of artificial intelligence and has been reviewed by an editorial team.