

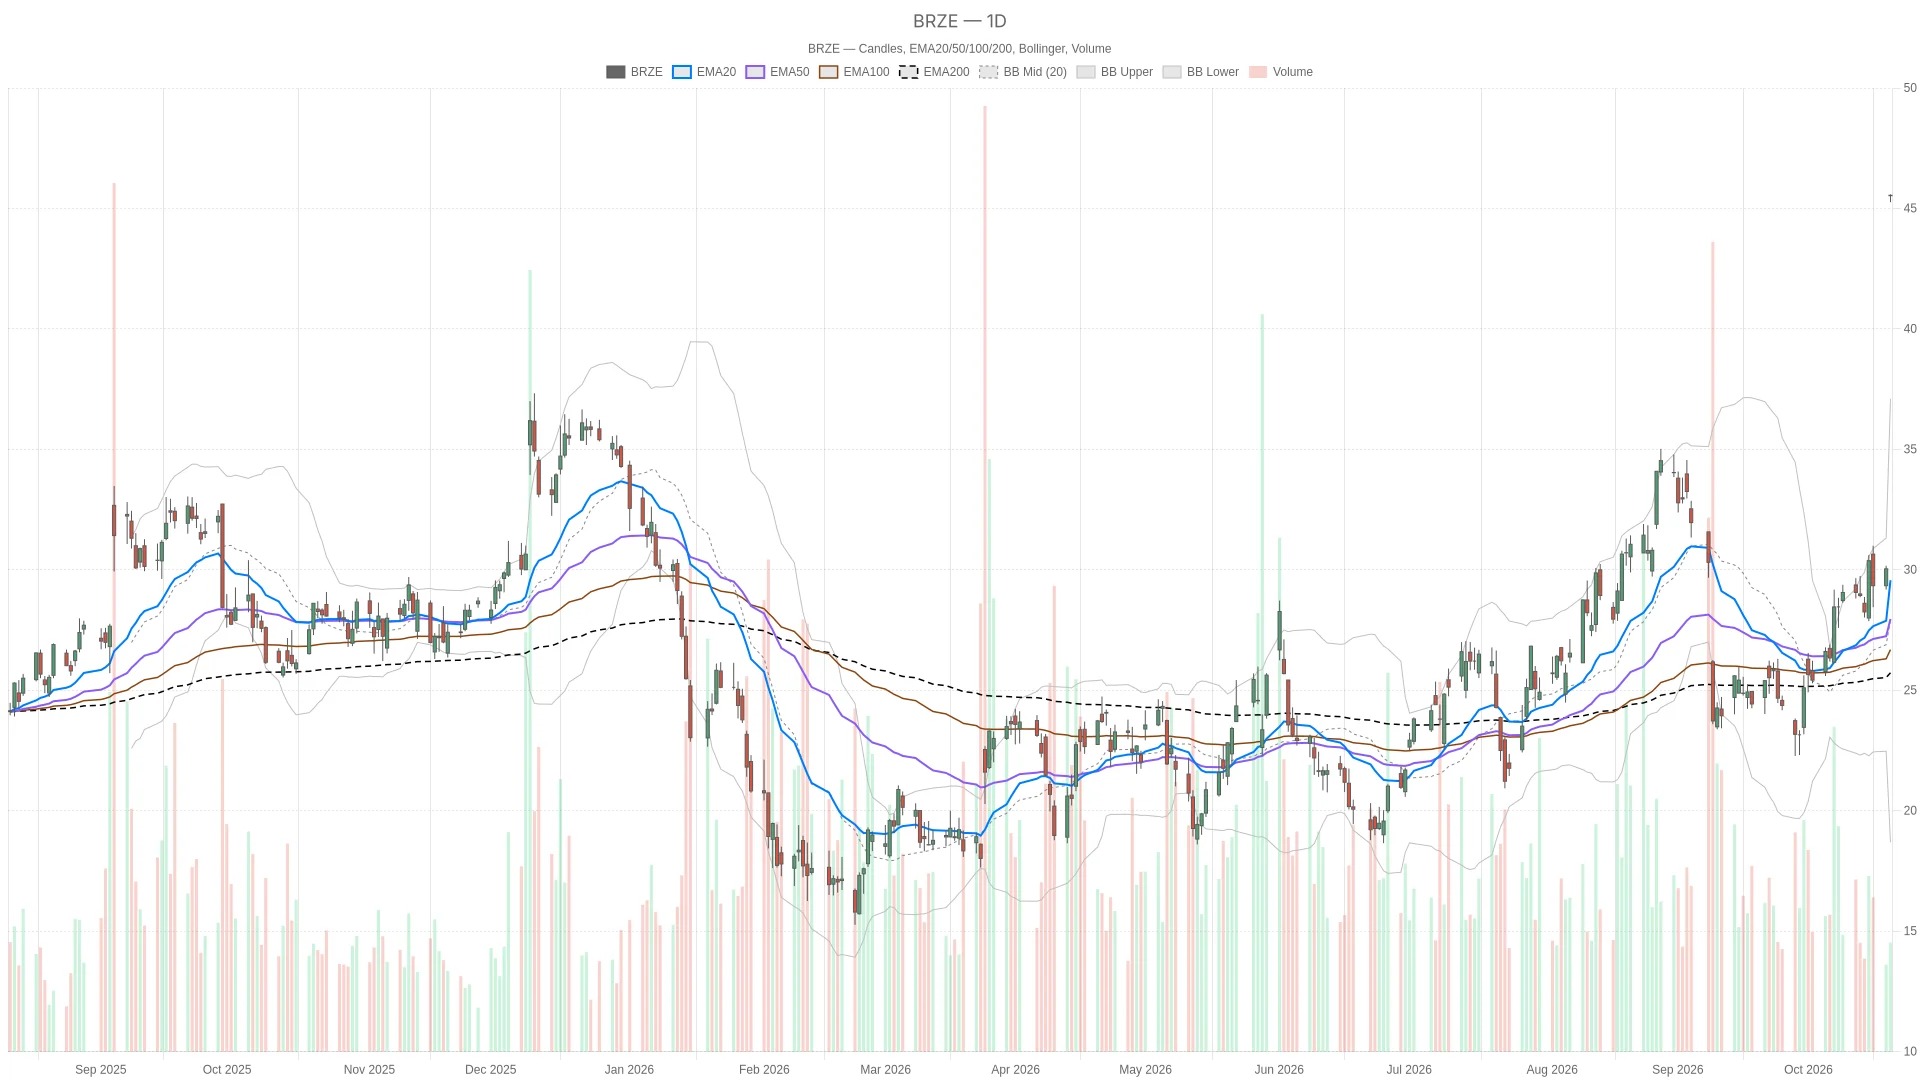
As of 12:53 Eastern Time on Tuesday, the stock price of Braze was reported at $45.545, representing a 51.61% increase from the previous trading day's close. Braze opened at $45.53, with a low of $45.26 and a high of $45.59 during the session, and the latest price is $45.55, compared to a previous closing price of $30.04. On the daily chart, EMA shows a bullish pattern, which supports a generally positive trend, but overbought readings in multiple time frames complicate the judgment of whether the stock will continue to rise in the short term.
Abstract
Key Points

- The daily line RSI14 is at 83.99, which is in the overbought range; the daily line MACD has a value of 1.43, and the MACD line is at 2.08, which is 0.65 higher than the signal line.
- The stock price is higher than the 20-day EMA at $29.57, the 50-day EMA at $27.96, and the 200-day EMA at $26.21.
- The hourly line RSI14 is at 94.57, and the 15-minute line RSI14 is at 96.2; both are in a clearly overbought range.
- The value of the MACD column after 15 minutes is 0.01, and the value of the MACD line is 3.85, which is only slightly higher than the signal line of 3.84.
Braze Trading Background of Stocks
At the same time, reports released during trading on Tuesday also mentioned that multiple ratings had been downgraded. These rating changes coexist with bullish chart patterns, but they alone are not sufficient to constitute a bearish technical analysis judgment.
Daily line structure indicates a bullish trend.
This complete bullish arrangement supports the judgment that the main trend is more likely to be upward, but it does not constitute a signal to enter the market.
It is worth noting that the stock price is also above the upper band of the daily Bollinger Bands at $37.1. This indicates that the price has moved beyond the upper band of the Bollinger Bands, rather than being close to the middle band. The daily ATR14 has risen from $1.51 on the previous trading day to $2.51, showing an increase in volatility indicators.
Hourly chart confirms the trend, but there is a risk of extension.
The hourly moving average also confirms the bullish judgment of the daily chart. The stock price is above the 20-hour EMA at $34.75, followed by the 50-hour EMA at $31.37 and the 200-hour EMA at $28.89. This also constitutes a complete bullish pattern.
However, the hourly chart RSI14 shows a value of 94.57, which is in a clear overbought state. The hourly chart MACD has a value of 3.71, still above the signal line of 1.81, and the column value for MACD is a positive 1.91. These readings support a bullish trend, but they do not eliminate the risk of excessive price increases.
The stock price is above the hourly Bollinger Band upper band of $45.45 and the hourly pivot point of $45.44, but still below the first hourly resistance level of $45.58. These pivot points are derived from the previous completed hourly candlestick, and they constitute the current decision-making range for real-time trading.
15 minutes MACD Narrow short-term trading window
In contrast, the value of the 15-minute MACD column dropped from 0.15 in the previous 15-minute period to 0.01. Its MACD line is 3.85, only slightly higher than the signal line of 3.84. With the RSI14 reaching 96.2, short-term execution faces issues of overbought readings, as well as a very small degree of separation with the MACD.
Bullish and bearish conditions
For the stock Braze, if it can hold the 15-minute pivot point of $45.54, it will support a short-term bullish outlook. If it breaks through the first hourly resistance level of $45.58, and then further breaks through the 15-minute first resistance level as well as the intraday high of $45.59, this judgment will be strengthened.
On the contrary, if it falls below the first support level of $45.49 for the 15-minute period, market attention will shift to the hourly pivot point of $45.44. Below that are the hourly first support level of $45.35 and the intraday low of $45.26. If the intraday low is lost, it would invalidate the judgment of a continued short-term upward trend, but it does not automatically imply a reversal of the daily EMA structure.
Overall, the stock price is above the nearby pivot point, but below the resistance levels of $45.58 and $45.59. The daily volatility has increased, and the overbought readings make the already complex situation even more complicated. Since the trading session has not yet ended, it is still uncertain whether these nearby support levels can be held.
Frequently Asked Questions
What were the reasons that drove the rise in the price of Braze on Tuesday?
The sharp rise on that day occurred after Salesforce announced its intention to acquire Braze through a cash transaction. During trading on Tuesday, there were also reports of multiple downgrades in ratings, but these factors alone are not sufficient to constitute a bearish technical analysis judgment.
Braze Is the stock in a overbought state?
Yes, and this is evident across multiple time periods. On the daily chart (RSI14), it is 83.99; on the hourly chart (RSI14), it is 94.57; and on the 15-minute chart (RSI14), it is 96.2. The stock price is also above the upper band of the daily Bollinger Bands at $37.1 and the upper band of the hourly Bollinger Bands at $45.45.
What are the key price levels that need to be monitored?
The current immediate decision-making range is constituted by a pivot point of $45.54 after 15 minutes and the first hourly resistance level of $45.58. On the lower side, the hourly pivot point of $45.44 and the first hourly support level of $45.35 are key supports. The intraday low of $45.26 serves as a more external bearish reference for this trading period.
Neither Cryptonomist nor the author holds any positions in the financial instruments mentioned in this text, nor have they received any compensation from the companies reported.
This article was generated with the assistance of artificial intelligence and has been reviewed by an editorial team.