

Key Points
- Cardano traded at around $0.201 on Monday, continuing its three-week downward trend.
- The funding rate has been adjusted to -0.0032%, further reinforcing the bearish trend in the derivatives market.
- The initial resistance level for ADA is at $0.213, and weak momentum makes rebound attempts prone to failure.
Due to continuous pressure on derivatives, spot prices, and technical indicators, Cardano fell below $0.202 on Monday. ADA traded at around $0.201 after three consecutive weeks of decline, with a cumulative drop of over 20% since the beginning of October. The token remains below several major moving averages, indicating that buying momentum has not yet established a sustained rebound.
Although the momentum has approached the oversold area, the overall structure still favors the sellers. Any short-term rebound will face multiple resistances before there is a substantial improvement in the outlook.
Derivative positions are biased towards short positions.
Data from CoinGlass shows that on Monday, the long-short ratio for Cardano was 0.92, close to its lowest level in over a month.
A reading below 1 indicates that, under this statistical metric, there are more short positions than long positions. This data suggests a cautious market sentiment, with traders still preferring downside exposures.
The funding rate for ADA has also turned negative, reaching -0.0032%. A negative funding rate means that short traders have to pay a fee to long traders in order to maintain their positions, which is in line with the market's stronger demand for bearish exposures.
These indicators collectively reinforce the weak price trend, but none of them can guarantee that the downward trend will continue.
The summary indicators for CryptoQuant also add a sense of caution. The platform has identified that there are large whale orders and overheated conditions in the Cardano futures market. Its spot and futures indicators also show a seller's dominance, indicating that the selling pressure does not come solely from leveraged positions.
A large order alone cannot determine the trading direction of whales. However, considering the imbalance in sell orders and the negative funding rate mentioned in the report, these data provide limited support for the conclusion that buying orders have significantly strengthened.
ADA remains below the key moving average
The daily technical structure of Cardano remains bearish, with prices below the 50-day, 100-day, and 200-day exponential moving averages.
These moving averages are roughly located between $0.218 and $0.237, forming a series of upper resistances.
The Relative Strength Index (RSI) is at 33, slightly above the usual oversold threshold of 30. This reading reflects ongoing weakness, but it also leaves room for a brief corrective rebound.
The MACD indicator remains negative, and the MACD line is below the signal line. Their weak bearish pattern does not provide a clear confirmation of a shift in momentum towards buyers.
Previously, the trend line was broken below $0.213, and this level constitutes an immediate resistance for Cardano. If a breakout to the upside occurs, buyers will also face the 100-day moving average of $0.218 and the 50-day moving average of $0.224. Further resistance is located around $0.236, which reinforces itself with the 200-day moving average of $0.237.
If it can continuously break through this resistance zone, $0.245 will come into view, while $0.299 represents an even more distant resistance level.
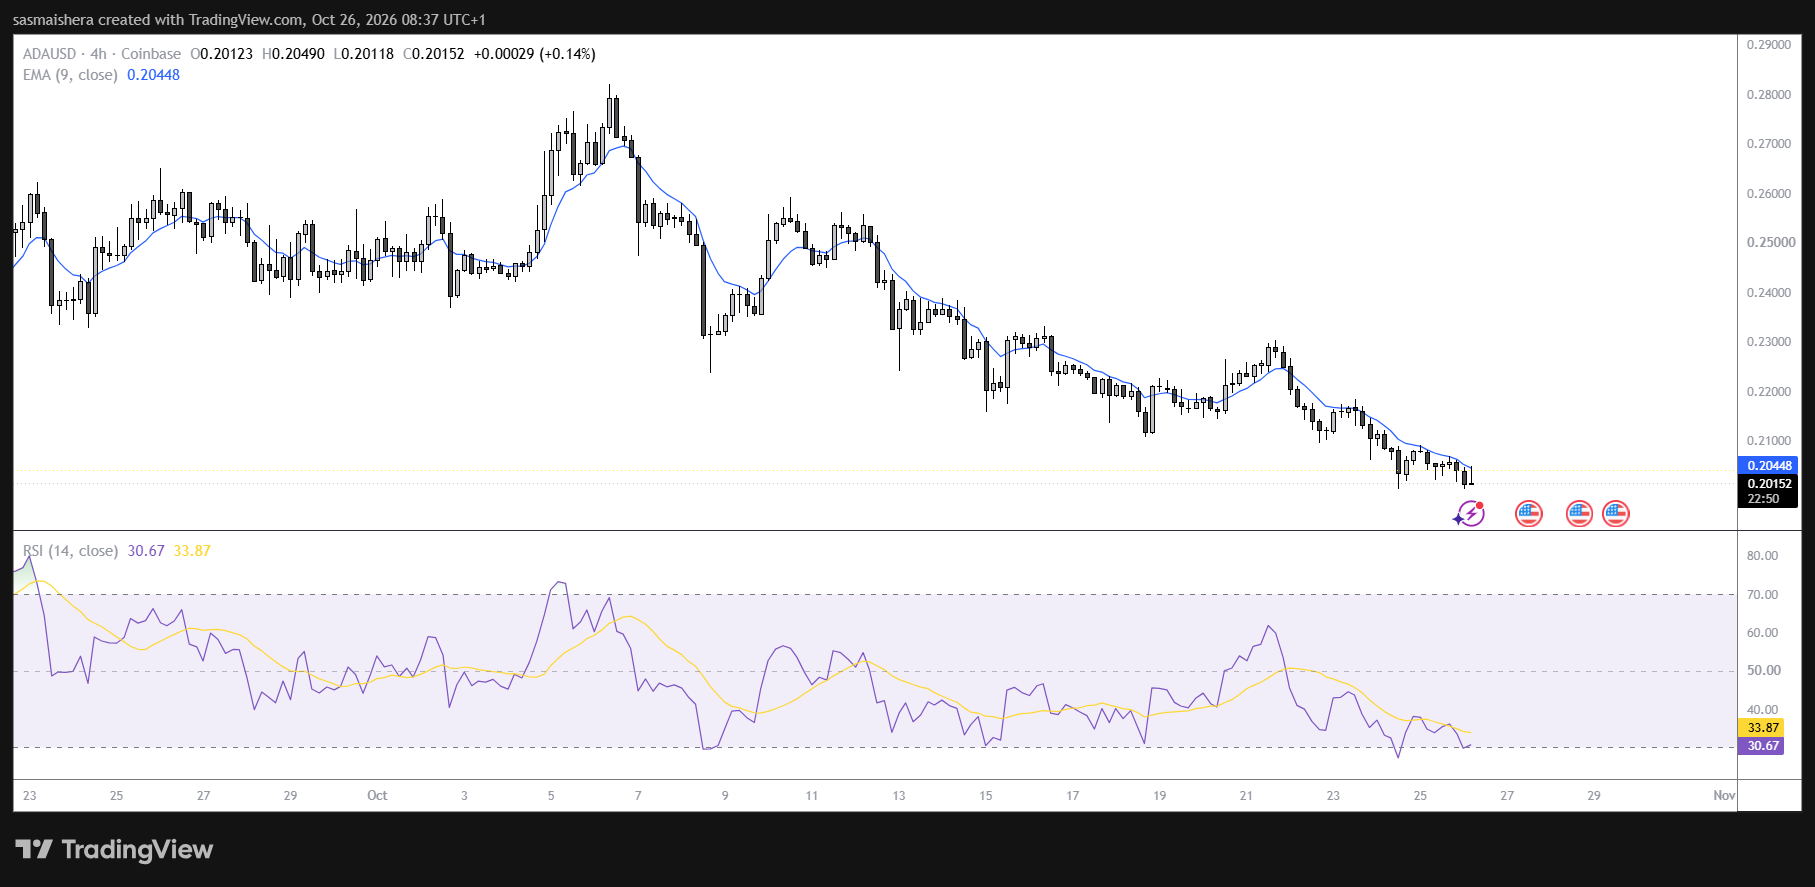
On the downside, since ADA is currently slightly above $0.200, this level represents a recent psychological barrier.
For buyers, regaining a level of $0.213 would represent a preliminary improvement. A more convincing rebound would require the ADA to break through multiple moving averages, accompanied by stronger momentum and reduced selling pressure.