

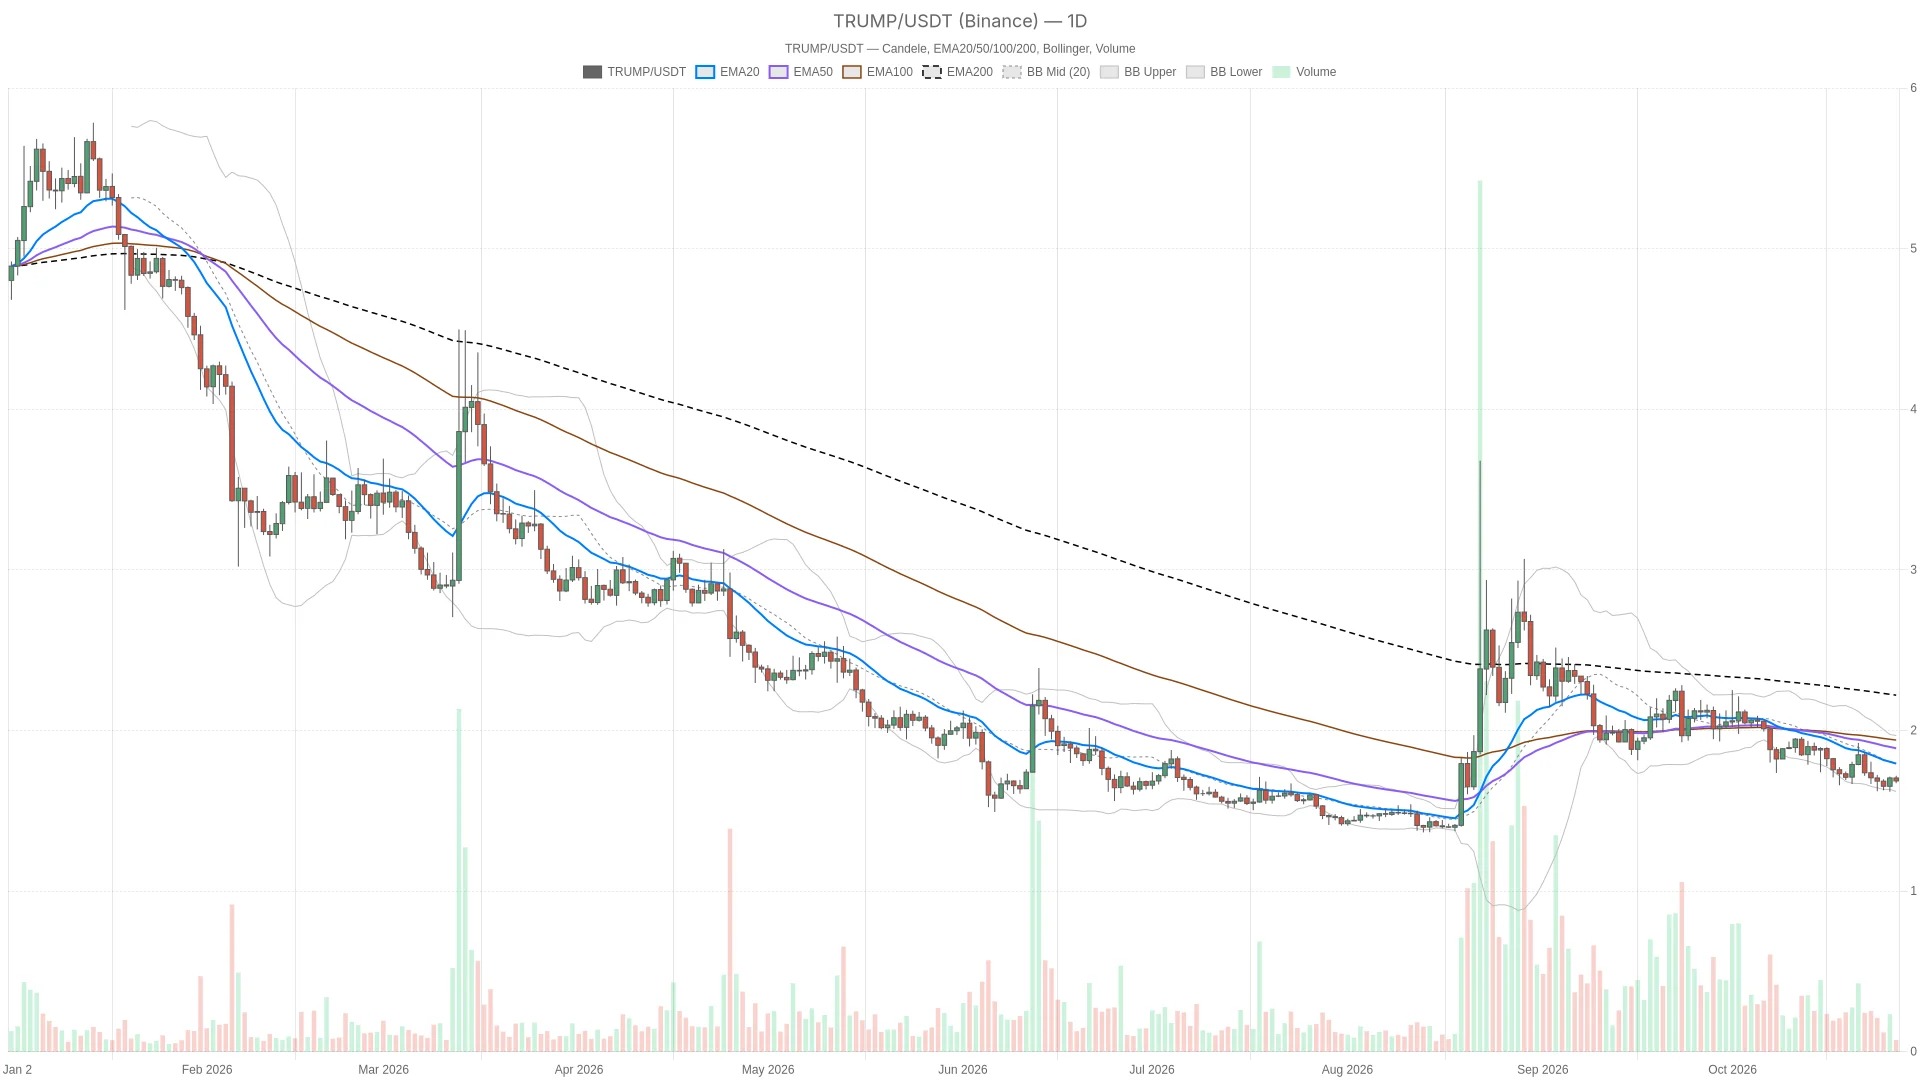
As of October 27, 2026, the trading price of TRUMP on Binance was 1.69 US dollars. Although there was a preliminary stabilization during the session, the daily chart structure of Trumpcoin remains bearish. The price is still below the three daily moving averages EMA. Although the momentum has improved, a structural reversal has not yet been formed.
Key Points
- TRUMP is trading at $1.69 in Binance, and it is below the three-day moving averages EMA, indicating a bearish pattern.
- The daily line RSI has improved to 40.1, but is still below the central axis; the negative MACD bar chart is narrowing.
- The daily pivot point of $1.68 is the key support that distinguishes between a potential rebound and a further decline.
- If the daily close is above $1.74, R1, a rebound will be confirmed; if it closes below $1.68, then the bearish outlook will be strengthened.
- The Fear and Greed Index is at 48, which is neutral, and it is not able to provide significant hedging against a bearish market structure.
At the same time, the current stalemate is as follows: the selling pressure on the daily chart has eased to some extent, but the hourly chart has not yet confirmed a sustained strengthening trend. The dominant force remains a downward trend; these rebound signals only indicate that a recovery may occur within a downward trend. This also makes the nearby daily pivot points particularly important: holding this position can preserve the possibility of a rebound, but it does not in itself establish a bullish trend.
Neutral emotions cannot provide significant counterbalance to a bearish structure.

Emotional indicators have not provided bullish support for TRUMP, therefore the bearish daily structure remains the main reference. CoinGecko shows that the total market value of cryptocurrencies is 2.69 trillion US dollars, with Bitcoin holding a dominant share of 59.43%. These are broader market reference data and do not imply that funds are flowing into TRUMP.
In this environment, the fear and greed index of Alternative.me is 48, which is classified as neutral. Emotions do not provide a strong directional confirmation for this token; therefore, its own price structure remains a more useful guide.
Trumpcoin is still below the bearish daily line EMA ranking.
The daily moving average line confirms a bearish structure, with the TRUMP price below all three moving averages. Candlestick chart data shows that the price is below the 1.80 USD level of the EMA20, the 1.90 USD level of the EMA50, and the 2.22 USD level of the EMA200. These moving averages are arranged in a bearish pattern, so any rebound will first encounter resistance above before it can credibly challenge the larger downward trend.
The situation on the hourly chart is not so clear. The price is below the levels of EMA20 and EMA200, but above EMA50; these moving averages do not form a consistent arrangement. This is merely a neutral disturbance to the bearish judgment on the daily chart, and does not confirm that the trend has reversed.
On the 15-minute chart, the price is below EMA20 and EMA50, but above EMA200. Moreover, the moving averages have not formed a consistent alignment. In terms of execution, this indicates that the short-term rebound is situated between the nearby upper pressure and the support provided by the longer-term moving averages. However, this does not overturn the daily chart structure.
Daily momentum has improved, but the hourly MACD has weakened.
The daily momentum indicator shows that bearish pressure has eased to some extent, but this improvement has not yet been confirmed on shorter time frames. The daily RSI is rising, currently at 40.1, while the daily MACD bar chart is still negative, although the negative value is narrowing. Downward momentum is weakening, but RSI is still below the midpoint, and MACD has not yet turned positive. The difference is that the weakening of bearish momentum does not mean that the bulls have taken control of the situation.
The hourly RSI is at 51.4, with no strong directionality. Additionally, its MACD bar chart has fallen below the zero axis and continues to decline, which weakens the possibility of a continuation of the upward trend in the short term. The MACD bar chart on the 15-minute chart has turned positive, and RSI has also risen to 48.4. However, this short-term improvement conflicts with the deterioration on the hourly chart and is not sufficient to confirm a larger-scale reversal.
The lower Bollinger Band on the daily chart is at $1.63, the middle band is at $1.80, and the upper band is at $1.97. The price is still in the lower half of this range; therefore, moving towards the middle band is more likely to be a mean-reversion rebound rather than a completed trend reversal.
In addition, the daily ATR is at $0.1224, while the hourly ATR is at $0.01803. Compared to nearby pivot points, the daily volatility indicators are quite significant, which means that a brief crossing of a certain threshold by the price is not as convincing as maintaining that level at the close of trading.
Daily pivot support distinguishes between a rebound and a possible continuation of the downward trend.
The daily pivot point of $1.68 is a key threshold that distinguishes between a rebound scenario and a continuation of the bearish trend. The most recent daily support level is the $1.68 daily pivot point; the most recent daily resistance level is the $1.74 daily R1. During the session, the hourly pivot point of $1.68 is below the current price, while the hourly EMA20 is the nearest upper resistance level. Although both the hourly and daily pivot points round to $1.68 when rounded, they represent different levels of price.
Bullish scenario: If the daily close is above the $1.74 level ( R1 ), it will confirm a breakout of the recent daily resistance. The next reference levels will be the middle band of the daily Bollinger Bands and the daily EMA20 level, both of which round to $1.80. If the subsequent daily close is below the daily pivot point of $1.68, then this bullish scenario will not hold.
Bearish scenario: If the daily close falls below the daily pivot point of $1.68, it will reinforce the dominant bearish outlook and expose the daily support level of $1.64, followed by the lower band of the Bollinger Bands at $1.63. If the daily close rises above the daily support level of $1.74, then this bearish scenario will be invalidated.
In this structure, the most likely false signal is when a breakout during the day is mistakenly interpreted as a reversal on the daily chart. The positive momentum on the 15-minute chart has already begun to weaken compared to the hourly MACD trend, and while the volatility on the daily chart allows prices to cross nearby levels, it may not necessarily lead to a sustained follow-through.
Frequently Asked Questions
Is the price TRUMP cited in the text the complete daily closing price?
No. $1.69 is the real-time candle price of Binance, not the complete daily closing price. The judgment in the text depends on the complete daily closing price.
Does an improvement in daily momentum mean that the outlook has turned bullish?
That's not the case. The daily chart RSI is improving, and the negative MACD bar chart is also narrowing, but the price is still below the three bearish daily charts EMA.
This article was generated with the assistance of artificial intelligence and has been reviewed by an editorial team.
Lorenzo Marcek is a financial journalist and senior crypto market analyst, renowned for his clear, data-driven reporting on digital assets. With a background in economics and over a decade of experience covering global markets, he specializes in on-chain indicators, institutional adoption trends, and macroeconomic factors that influence cryptocurrency volatility. His work combines investigative journalism with technical market insights, making him a trusted source for traders seeking solid, actionable analysis.