

Despite the rise during trading on Wednesday, the bearish tone on the daily chart of NBIS's stock price still persists. The stock price of Nebius Group is below the averages of three key daily indicators, however, positive signals on the hourly chart complicate the outlook. Signals from different time frames conflict with each other, resulting in no clear direction for NBIS's stock price at present.

Key Points
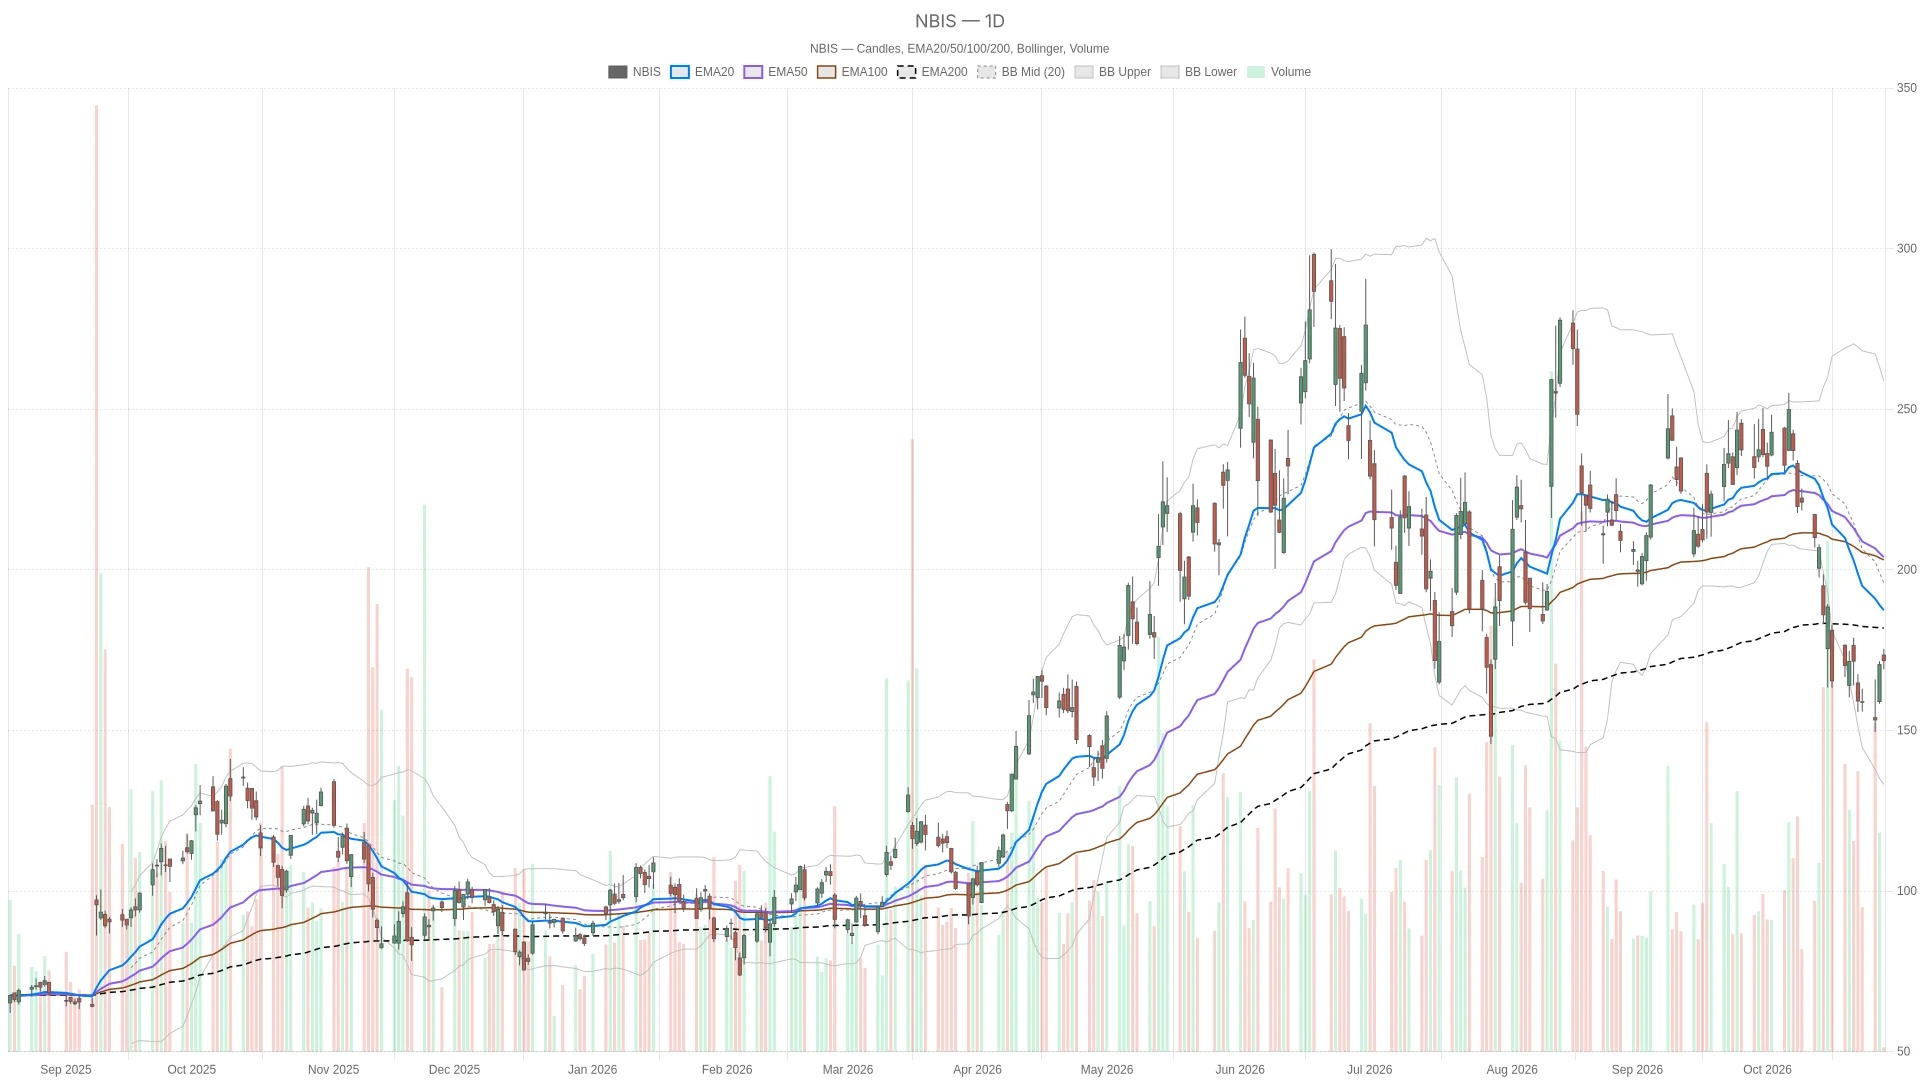
- As of 12:13 Eastern Time on Wednesday, NBIS was trading at $171.745, up 0.75% from the previous close.
- The daily line RSI14 is at 39.54, which is below the neutral level of 50.
- The stock price is still below the 200-day moving average of $180.38, the 20-day moving average of $187.4, and the 50-day moving average of $203.91.
- The daily line MACD bar chart shows -2.61, and the MACD line shows -16.68, which is below the signal line of -14.07.
- The hourly chart RSI14 shows a value of 58.81, which is higher than 50, and this conflicts with the weaker daily momentum readings.
NBIS Stock price faces resistance above the daily line
NBIS The stock price is under pressure from the three daily moving averages, with the current price being above all of them. The most recent resistance level is the 200-day moving average at $180.38.
On Wednesday, October 28, 2026, Nebius opened at $173.45, fell to a low of $169 during the session, and rose to a high of $175.41. As of 12:13 Eastern Time, the stock price was at $171.745, up 0.75% from the previous closing price of $170.47. This trading session has not yet ended.
Daily Trend and Momentum Reading
The 20-day moving average is at $187.4, and the 50-day moving average is at $203.91. The price being below these three moving averages indicates a relatively weak daily chart structure. However, these moving averages do not form a complete bearish pattern.
Daily momentum also provided some limited reversal signals. The RSI14 value is 39.54, which is below 50 but has not yet entered an oversold area. The daily MACD bar chart has rebounded from -4.12 to -2.61, but the MACD line is still below the signal line, at -16.68 and -14.07 respectively.
Bollinger Bands, Volatility, and Pivot Points
At the same time, the price is below the middle band of the daily Bollinger Bands at $195.95 and above the lower band at $133.16, indicating that it is in the lower half of the Bollinger Band structure. The daily ATR14 indicator has decreased from 16.11 to 15.42. This smaller reading does not change the bearish trend of the price.
From the perspective of trading session structure, the daily pivot point of $166.77 is below the current price. The first resistance level R1 is at $175.23, and the first support level S1 is at $162. These levels are derived from the previous completed daily candlestick and are applicable to the current trading session.
The strong momentum at the hourly level complicates the daily perspective.
The hourly chart indicators present a more positive outlook than the daily chart. The price is above both the 20-hour and 50-hour moving averages, and the hourly RSI14 is also higher than 50. However, the longer-term 200-hour moving average remains above as well.
Hourly Trends and Momentum
Compared to the daily chart structure, the stock price of NBIS is currently above the 20-hour moving average of $167.09 and the 50-hour moving average of $169.53, but it remains below the 200-hour moving average of $195.12. The shorter-term moving averages support a bullish outlook at the hourly level, while the longer-term moving averages continue to exert downward pressure.
It is worth noting that the value for the hour RSI14 is 58.81, which is higher than 50. The value for the hour MACD line is 2.12, which is also higher than the signal line of 0.78, and the bar chart shows a positive value of 1.35. These readings contrast with the negative structure of the daily line MACD. However, the price is still below the hourly pivot point of $172.88 and the first support level of $171.81, which limits the strength of any short-term confirmation.
15-minute chart signal
From a shorter-term execution perspective, the signals on the 15-minute chart are rather mixed. The price is above the 20-period moving average of $171.43 and the middle band of the Bollinger Bands at $171.57, but below the pivot point of $172.29. The RSI14 value is 55.9, which is higher than 50. However, the MACD line at 1.32 is lower than the signal line at 1.59, and the candlestick chart shows a value of -0.27. The divergence between different indicators makes it difficult for this shortest time frame to provide clear timing signals.
Financing reports mention funds for data centers
According to a report published by Investing.com on Tuesday, October 27, 2026, Nebius has raised approximately 250 million euros, which is about 279 million US dollars. The report states that this financing is related to its planned data center near Lille.
NBIS Bull and Bear Scenarios for Stock Prices
Whether the stock price can hold the daily pivot point of $166.77 in the future will determine the divergence between the two scenarios. The bullish scenario requires holding this level and regaining multiple resistance levels; the bearish scenario will be triggered after breaking below the hourly moving average.
The bullish scenario requires the price to hold above the daily pivot point of $166.77. First, it needs to re-cross above the 15-minute pivot point of $172.29, followed by the hourly pivot point of $172.88. If it further breaks through the daily R1 of $175.23, the bullish scenario will be strengthened. Above that, the daily EMA resistances are located at $180.38, $187.4, and $203.91 respectively.
On the contrary, if it falls below the 50-hour moving average of $169.53, the supportive hourly structure will be weakened. The next reference points are the 20-hour moving average of $167.09 and the daily pivot point of $166.77. If the daily pivot point is lost, the short-term bullish scenario will become invalid, and the daily S1 of $162 will become the focus of attention.
Frequently Asked Questions
NBIS What is the current stock price?As of 12:13 on Wednesday, October 28, 2026, Eastern Time, NBIS was trading at $171.745, up 0.75% from the previous closing price. Trading is still ongoing during this session.
What are the key resistance levels for NBIS's stock price?The daily line R1 pivot point of $175.23 serves as resistance. Above that are the 200-day moving average at $180.38, the 20-day moving average at $187.4, and the 50-day moving average at $203.91.
Is the daily trend for NBIS bullish or bearish?The daily chart structure is bearish. The price is below the averages of three key daily indicators; the daily RSI14 level is at 39.54, which is below the neutral 50 mark, and the daily MACD line is also below the signal line.
Do hourly-level signals support different viewpoints?Yes. The conditions on the hourly chart are more positive. The price is above both the 20-hour and 50-hour moving averages; the hourly RSI14 is at 58.81, which is higher than 50, and the hourly MACD is also positive. However, the 200-hour moving average of $195.12 is still above.
Cryptonomist and the author do not hold any positions in the financial instruments mentioned in this text, nor have they received any compensation from the companies reported.
This article was generated with the assistance of artificial intelligence and has been reviewed by an editorial team.
Lorenzo Marcek is a financial journalist and senior crypto market analyst, known for his clear, data-driven reporting on digital assets. With a background in economics and over a decade of experience covering global markets, he specializes in on-chain indicators, institutional adoption trends, and macroeconomic factors that influence cryptocurrency volatility. His work combines investigative journalism with technical market insights, making him a trusted source for traders seeking solid, actionable analysis.