

Key Points
- XRP Tumbled below $1.30 on Thursday, continuing the bearish trend.
- Tracking data shows that the long-to-short ratio is 0.82, indicating that market positions are biased towards short selling.
- XRP needs to retest the resistance range between $1.333 and $1.372 for the short-term technical outlook to improve.
XRP Under Pressure After the Fed's Cautious Stand-Off
XRP continued to face pressure on Thursday, with bearish positions in the derivatives market and ongoing selling activities limiting its prospects for a rebound.
XRP traded around $1.29, breaking below the closely watched support level of $1.300. Previously, the Federal Reserve decided to maintain interest rates at 3.75% to 4.00% unchanged.
Despite no adjustment to interest rates, ongoing concerns about inflation and a relatively hawkish tone have dampened the market's appetite for risk assets.
CoinGlass data shows that the long-short ratio of XRP is 0.82, which is close to the lowest level in over a month.
A short-to-long position ratio of less than 1 indicates that, within the statistical sample, there are more short positions than long positions, further reinforcing a cautious positioning strategy regarding these tokens.
However, the funding rates signal differently for various assets. The funding rate for XRP is 0.0036%, and it has remained positive since it strengthened on October 16th.
This means that the longs are paying a fee to the shorts, indicating that despite the relatively weak long-short ratio, there is still a certain demand in the market for leveraged bullish positions.
This deviation makes the derivative signals of XRP appear rather mixed, but currently, bears still clearly hold the dominant position.
The summary indicators of CryptoQuant show that both the spot and futures markets of XRP are dominated by sellers.
Regarding XRP, the platform also indicates the presence of large whale orders and a overheated market situation. Alone, large orders are not sufficient to determine whether major traders are buying or selling, but combined with the imbalance in sell orders, the overall outlook remains bleak.
The spot and futures markets for XLM still show that sellers are in the majority, indicating that the recent rebound has not attracted enough demand to support a stronger upward trend.
After breaking below the $1.300 support level, XRP may continue to fall further.
The XRP / USD daily chart still maintains a bearish pattern, and the token has fallen below the support level around $1.300.
If the daily closing price falls below this level, the recent trading range will be weakened, and the risk of a deeper pullback will also increase.
The daily relative strength index ( RSI ) is at 40, which is below the neutral level of 50, indicating that the buying momentum is still limited.
The Smooth Convergence/Divergence Moving Average ( MACD ) indicator has shown a slight improvement, entering a positive range. This provides an early signal that the bearish momentum is weakening, however, the price is still below the key moving averages.
The first resistance level above XRP is the 100-day exponential moving average around $1.333. Above that, the $1.357 50-day EMA and the $1.372 200-day EMA form further resistances.
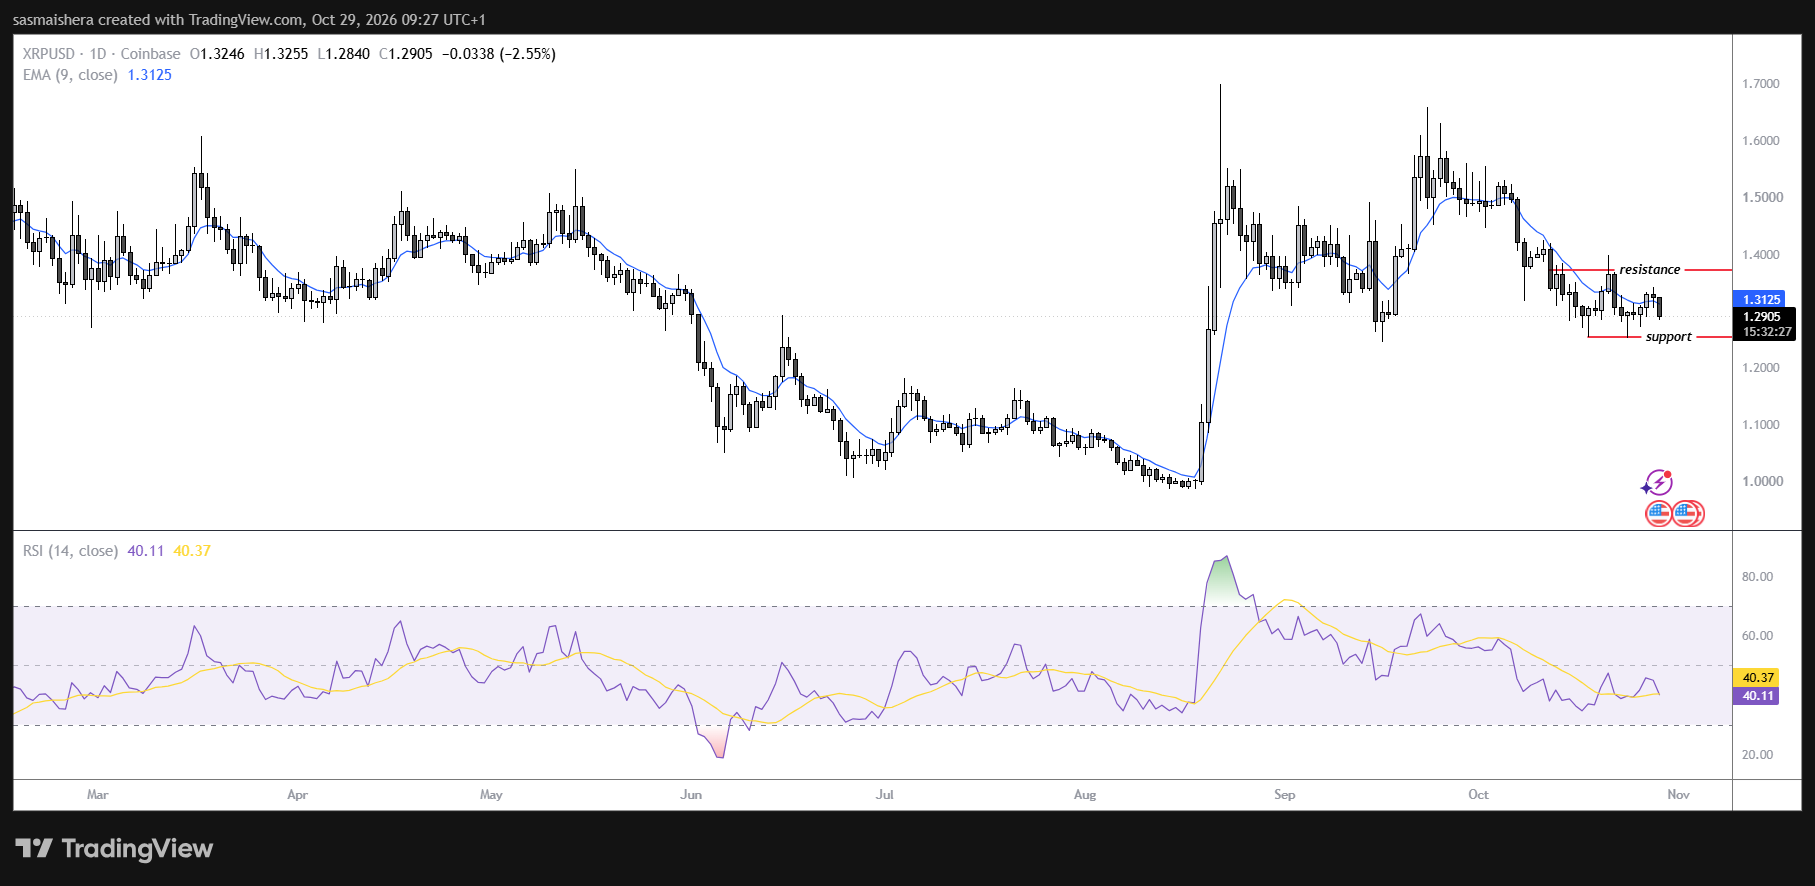
If this area can be recaptured, it will more strongly indicate that the buyers are taking back control of the situation. Higher resistance levels are at $1.540 and $1.900, but these two positions are still quite far from the current price.
Currently, XRP is not far above the support level, leaving little room for another round of selling pressure. Whether it can hold above $1.300 and break through the nearby moving averages remains the key test to determine whether it can experience a more sustained recovery.