

Key Points
- Cardano ( ADA ) closed at around $0.188 on Tuesday, continuing its recent downward trend after breaking below a key support level.
- ADA The funding rate has turned positive, indicating that some traders are still betting that prices may rebound.
- The resistance level above ADA is between $0.215 and $0.218; if the price continues to fall, it may further test the support level of $0.155.
Cardano ( ADA ) continued to face pressure on Tuesday, trading at around $0.188. After breaking below an important support level on the previous trading day, the price continued to fall.
This cryptocurrency has struggled to attract buyers, and weakening technical indicators suggest that the recent pullback may not have yet ended.
Derivative data also shows a divergent trend. Although the funding rate for Cardano has returned to a positive range, the long-short ratio indicates that short positions still dominate.
At the same time, indicators of on-chain and trading activity show that selling pressure continues. Unless buyers regain key resistance levels, ADA is still at risk of further decline.
Cardano Derivative data indicates that traders remain cautious
As traders weigh the possibility of a price rebound against the risk of another decline, the Cardano derivatives market is showing signs of uncertainty.
According to CoinGlass data, the long-short ratio of ADA on Tuesday was 0.8248, near the lowest level in over a month.
A ratio lower than 1 indicates that in the market being analyzed, there are more short positions than long positions, suggesting that there are more traders betting on a decline than those betting on a rebound.
However, it seems that the bullish traders who were affected by the funding rate changes have not completely withdrawn from the market.
The funding rate for Cardano turned positive on Tuesday, reaching 0.0097%.
A positive funding rate means that traders holding long positions need to pay a fee to traders holding short positions in order to maintain their leverage exposure.
This indicates that, despite the overall weak price of ADA, there are still some market participants willing to bet on a potential rebound.
The difference between these two indicators indicates that traders still have disagreements regarding the next move of Cardano.
The long-short ratio reflects a bias towards short positions, while the positive funding rate indicates that there is still demand for leveraged long positions.
This differentiated position structure may exacerbate volatility, especially when there are sudden price changes that force leveraged traders to close their positions.
However, for now, derivatives data do not indicate that market sentiment has clearly shifted to bullish.
In addition to derivative positions, the spot and futures markets of Cardano also show signs of weakness.
According to the market summary of CryptoQuant, both the spot and futures markets have recorded large whale orders, accompanied by overheating signals and seller-dominated indicators.
The emergence of large orders indicates that major market participants are still actively trading, but the accompanying selling pressure suggests that the trading environment remains cautious.
Whale activities can have a considerable impact on price trends, especially during periods of weaker liquidity or increased volatility.
When large orders and seller dominance occur simultaneously, the market will be more concerned about further downward pressure.
The overheating signal of CryptoQuant also indicates that market activity is at a relatively high level, which may make ADA more prone to sharp price fluctuations.
Overall, although the funding rates in the derivatives market are positive, these indicators still indicate a seller's advantage.
However, whale orders alone cannot prove that large holders are selling off their existing ADA positions. To make a clearer judgment, more data regarding exchange capital flows and wallet activities is needed.
Before the buying demand increases, the current market environment may make it difficult for Cardano to establish a sustained rebound.
ADA is at risk of falling further to $0.155
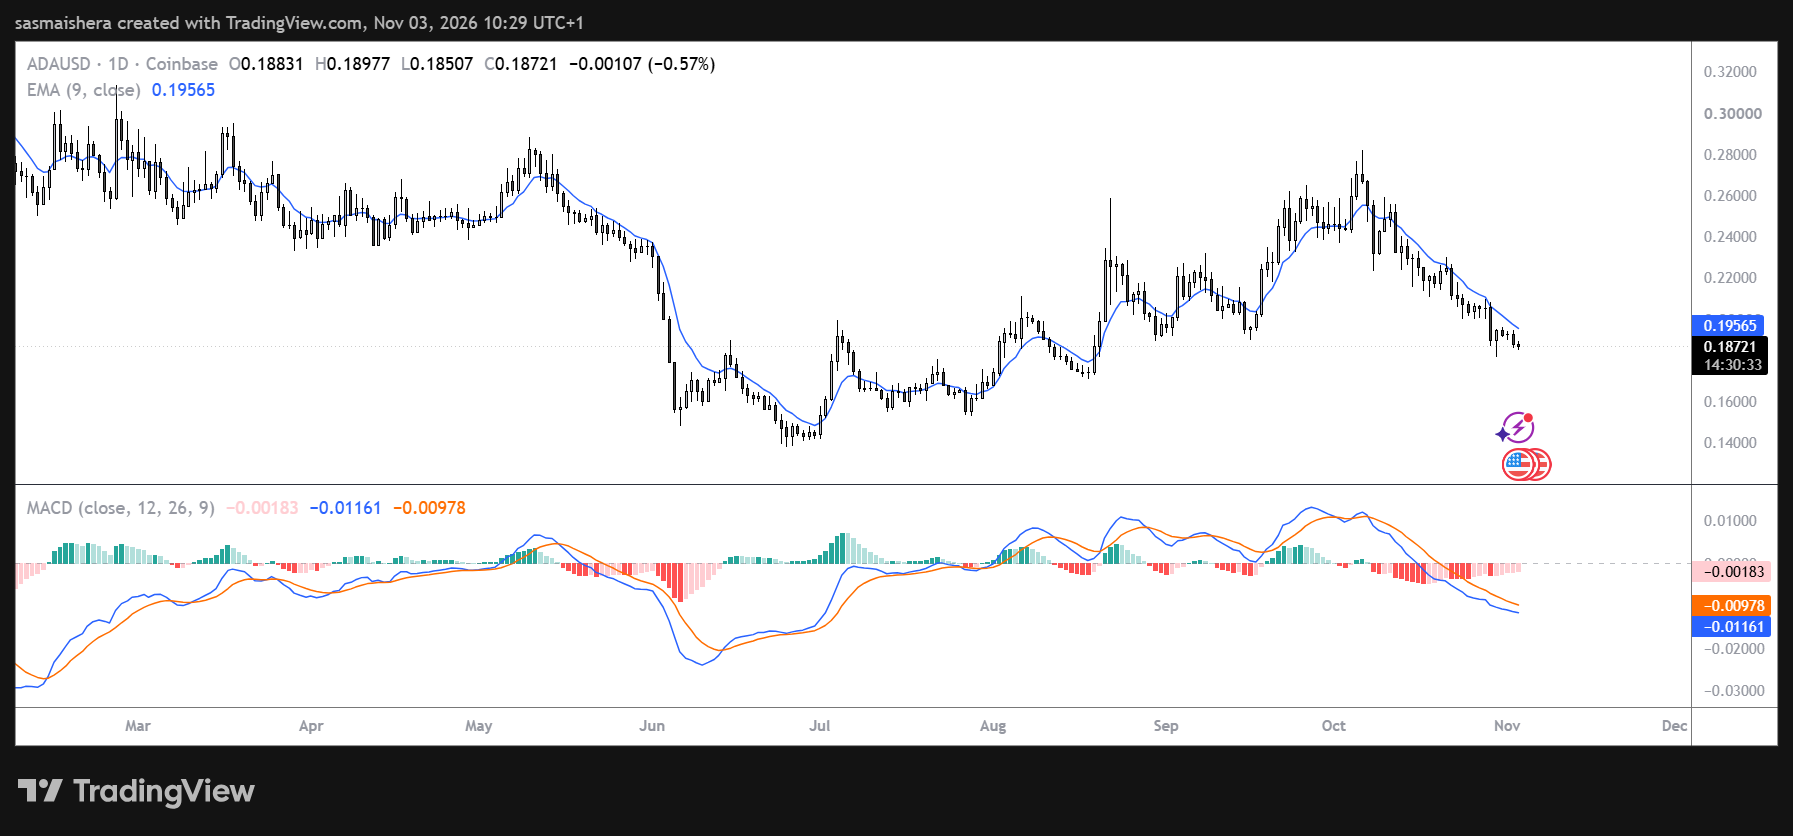
Cardano traded at around $0.187 on Tuesday, and the daily technical pattern still favors the sellers.
This cryptocurrency has fallen below its previous upward support trend line, which now acts as resistance around $0.218.
The loss of this trend line weakens the price structure of ADA, indicating that buyers are having difficulty maintaining the levels that previously supported the market.
Cardano is currently also below the 100-day moving average of EMA at $0.215 and the 50-day EMA at $0.216.
Both of these moving averages are significantly higher than the current price, forming a resistance zone that may limit any attempt at a rebound.
The momentum indicator also reinforces a cautious outlook. The Relative Strength Index ( RSI ) is hovering around 30, bringing the ADA close to the oversold area.
This means that the selling pressure may have been a bit excessive, but it doesn't necessarily mean that a rebound is about to occur.
When bearish momentum is strong, cryptocurrencies may remain in the oversold area for an extended period of time.
At the same time, MACD is still slightly negative, indicating that although the momentum has weakened, sellers still hold the dominant position.
On the upside, the first major resistance level for Cardano is between $0.215 and $0.218. This area encompasses the 100-day EMA at $0.215, the 50-day EMA at $0.216, as well as the previous upward support trend line near $0.218.
If this range can be continuously regained, it would be a positive signal for buyers and could potentially open up space towards $0.236.
Further up, the 200-day EMA level of around $0.239 is another important resistance. If the bullish momentum is sufficient to break through these levels, ADA could see a further rebound to the $0.245 resistance level, followed by the even higher $0.299 resistance level.
However, such a trend requires a significant improvement in buying demand and overall market sentiment.
On the downside, the next major support level indicated on the chart is at $0.155.
If it continues to fall to that area, it will mean that the current correction will further expand.
The level of $0.155 may attract buying interest, but whether a sustained rebound can be formed depends on whether demand is sufficient to absorb the current selling pressure.