

A figure of nearly 9.5 trillion euros has decreased by 2.3%, which can easily be summarized as "capital flight." However, the stock of foreign direct investment is not merely a statement of new capital inflows and outflows; it is also affected by exchange rates, asset valuations, corporate reorganizations, and special purpose entities. Data released on November 5th for 2025 by Eurostat indicates that the stock of non-EU direct investments held by EU residents has dropped to 9.479 trillion euros, a decrease of 2.3% from 9.701 trillion euros in 2024; meanwhile, the stock of EU investments held by non-EU investors has fallen to 6.988 trillion euros, representing a year-on-year reduction of 2.8%.
Both directions are contracting, but the scale is not symmetrical.
The stock of EU outward foreign direct investment is still significantly higher than that of external investors in the EU, with a difference of nearly 2.5 trillion euros. This reflects that European companies and investment entities hold a large amount of long-term interests globally, and it also indicates that one cannot judge attractiveness solely based on unilateral declines. If both outward and inward investment volumes decrease simultaneously, valuation and corporate restructuring may come into play along with actual withdrawal of capital.
The continuous decline in memory usage from the high of 787.8 billion euros in 2022 is worth continued observation. However, the reduction in stock does not automatically tell us which industry it occurred in, whether it was due to the sale of operating assets or internal reorganization, nor can it directly replace the investment flow of that year. To determine whether a company is truly withdrawing, it is also necessary to consider mergers and acquisitions, greenfield investments, reinvestment of earnings, and the balance sheets of multinational corporations.
The United States and the United Kingdom still occupy the two highest positions.
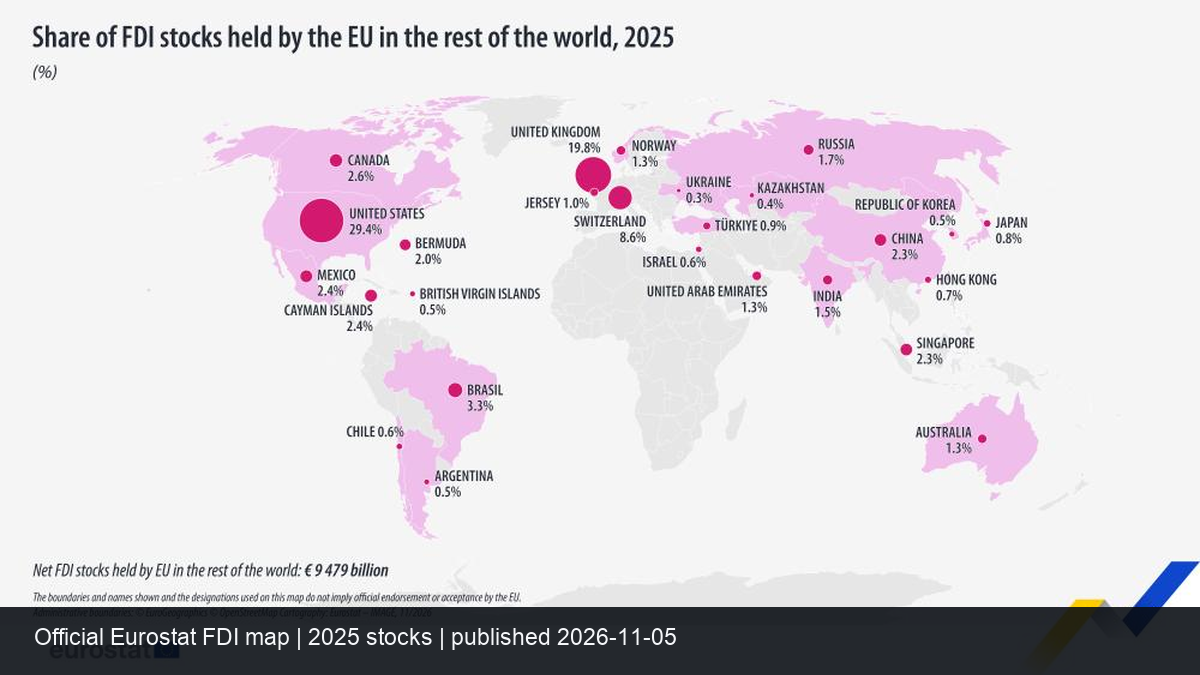
By the end of 2025, the United States accounted for 29.4% of the total foreign direct investment absorbed by the European Union, amounting to 279.1 billion euros; the UK accounted for 19.8%, or 187.7 billion euros. Together, these two countries accounted for nearly half of the total. Following them were Switzerland with 81.2 billion euros, accounting for 8.6%; economies such as Brazil and Canada had even smaller proportions. This distribution indicates that the overseas assets of EU companies are highly concentrated in mature markets, and any changes in exchange rates or valuations could significantly affect the overall amount.
The same is true in the reverse direction. American investors hold a direct investment stock of 207.5 billion euros within the EU, accounting for 29.7%; the UK holds 126.2 billion euros, accounting for 18.1%; Switzerland holds 60.2 billion euros, accounting for 8.6%. Cross-Atlantic investment relations remain the backbone of the EU's capital network. The decline in these figures has not changed this structure; it merely serves as a reminder to the market that geopolitical risks, interest rates, and corporate profits can be rapidly transmitted through a few major economies.
Special-purpose entities make the map look more complex.
Eurostat highlights the importance of special-purpose entities. By the end of 2025, such entities accounted for 26.2% of the EU's outward direct investment stock and 33.3% of the investment stock from other regions of the world in the EU. They are commonly used for group financing, shareholding, tax purposes, or as a means of funds transfer, and their registration locations do not necessarily coincide with the final production and employment sites.
This is why jurisdictions such as the Cayman Islands and Bermuda hold a prominent position in investment portfolios. Just because the share of a certain place increases does not necessarily mean that factories and research and development centers are moving there; similarly, a decrease in share should not be simply interpreted as the disappearance of physical operations. Analysts need to distinguish between direct trading counterparts and ultimate investors, and to identify whether funds are merely passing through a layer of corporate structures.
How should "decrease in stock" be pronounced?
The first step is to acknowledge that data can be revised. Direct investment statistics rely on corporate declarations, identification of cross-border structures, and valuation, and subsequent information may change the initial figures. The second step is to separate stock from flow: stock refers to "the total amount held at a certain point in time," while flow refers to "the net increase or decrease over that period." The third step is to take into account prices and exchange rates. If the market value of an overseas company declines, even if not a single share of its parent company in the EU is sold, the stock of foreign investments may still decrease.
For policymakers, a more relevant question is whether the structure supports the real economy: whether new capital is flowing into production, technology, and employment, whether profits are reinvested, and whether key industries are overly dependent on a single source. For businesses, it is important to focus on how financing costs, regulatory differences, and supply chain reorganizations affect cross-border allocation. A percentage of the total amount is just an entry point, not a conclusion.
Data for 2025 indeed shows that cross-border direct investment assets in the EU have contracted on both sides, but this does not alone prove "de-Europeanization" or a "flight of European capital." A more cautious interpretation is that the global long-term investment network is being re-priced in terms of valuation, interest rates, and corporate restructuring, with the United States and the United Kingdom still firmly occupying central positions. What needs to be watched next is whether this apparent contraction will continue, and whether it will ultimately translate into real investment and employment.