


What's the latest US stock market trend? The Dow Jones recorded three 1,000-point swings in four days. Is this a subsequent reversal or a bull trap? According to CoinMeta data, on November 9, the Dow Jones closed up 1,104.02 points at 52,389.75. Last Wednesday it surged 1,569.40 points, and last Thursday it plunged 1,833.06 points. Three 1,000-point-level swings in four days represents a frequency not seen since March 2020. Currently, while VIX has fallen back to around 20, VXN remains stuck at 34. The risk pricing of tech stocks has not synchronously repaired along with the broader market sentiment. Is the follow-up move a reversal or a bull trap?
Table: Overview of Latest US Stock Market Key Data
Note: The above content is compiled and summarized by CoinMeta based on public market data. Please refer to actual data if there are any fluctuations.What's the Latest US Stock Market Trend?
What are the characteristics of the latest US stock market trend? There is currently a directional divergence between broad market sentiment indicators and tech stock risk indicators.
Monday's 1,104.02-point rebound by the Dow Jones was indeed remarkable in breadth: industrials and consumer discretionary led the gains, technology, materials, and real estate strengthened across the board, and the S&P 500 saw the highest number of advancing stocks in a single day this year.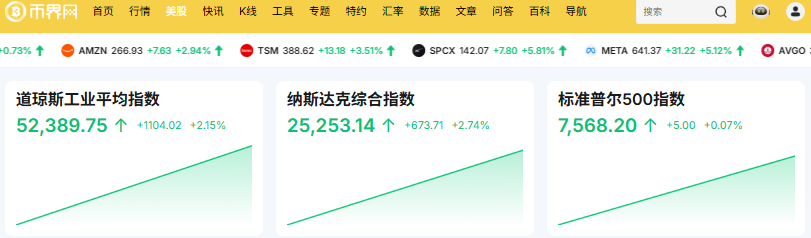
Image: Latest Trends of the Three Major US Stock Indices
However, the VIX, which measures market panic, falling back to near its historical average of 20 does not mean risks have been eliminated. Our analysis suggests that the VXN, which tracks the Nasdaq 100, is a better barometer for this year's stock market turbulence. This index, after surging sharply last week, remains hovering around 34, far above the long-term volatility range center of 25. VIX prices the future volatility of the S&P 500, while VXN prices the future volatility of the most crowded AI and tech trades.
Why Did the Dow Have Three 1,000-Point Swings in Four Days?
We analyze that the direct drivers of the Dow's three 1,000-point swings in four days were falling oil prices and oversold bottom-fishing, but the deeper reason is that AI policy expectations have changed, leading to concentrated selling of tech stock positions.
Falling Oil Prices Provided the First Spark for the Rebound
Cooling Middle East tensions combined with ample supply caused oil prices to post their largest weekly drop since 2020. Brent crude's front-month contract fell over 16% for the week, with WTI briefly dropping below $90 per barrel; the national average gasoline price fell from $4.13 per gallon on Election Day to about $3.96 on November 10.
We saw that as soon as oil prices fell, the market's immediate anxiety over inflation eased, giving Monday's buying a visible, tangible reason.Forced Liquidation of Leveraged Capital Amplified the Downtrend
What truly caused Thursday's 1,833-point decline to spiral out of control was leverage rules forcing people to sell.
As of September 2026, US margin debt stood at $1.48 trillion, peaking at $1.502 trillion in June, accounting for about 2.2% of the S&P 500's total market cap, higher than levels during the 2000 dot-com bubble. When the Nasdaq Composite plunged 5.52% and the Philadelphia Semiconductor Index dropped 12.25% on November 5, the VIX panic index soared from 16.61 to 28.18, a single-day gain of 69.66%. Volatility limits and margin call mechanisms were triggered simultaneously, and a large number of positions were automatically liquidated during the decline.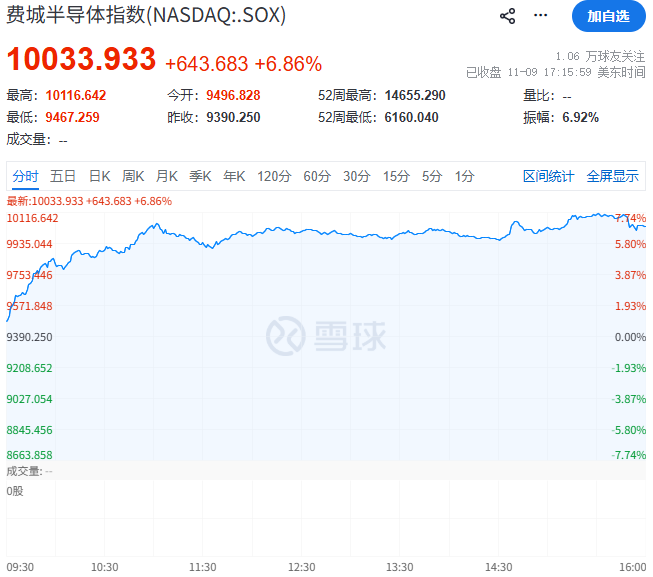
Image: Latest Philadelphia Semiconductor Index
AI Policy Wind Changed, Tech Stocks Were Repriced
After the November midterm elections, congressional leadership changed. Policies that were previously relatively friendly to the AI industry may no longer be as friendly.
People began to worry in advance: data center approvals and regulation could slow down. Some estimate that by 2028, about 30% of US data center capacity could be delayed. On one hand, policy expectations worsened; on the other, investors were selling stocks. Both pressures weighed on tech heavyweight stocks simultaneously. Combined, these factors mean policy could worsen while capital is withdrawing, subjecting tech stocks to pressure from both sides.Reversal or Bull Trap?
Is the upcoming US stock market trend a reversal or a bull trap? In our view, before the CPI data is released, it looks more like a bull trap in the short term, but the medium-term structure does not support a simple conclusion.
The reversal side argues: Over the weekend, negative news such as the Nvidia CEO scandal and Texas taking action against Musk's companies emerged, yet the market still rose. Historically, "rising despite bad news" is often seen as a bottoming signal. Additionally, the VIX term structure returning to normal from inversion also historically often corresponds to market bottoms.
However, we note two counter-evidence points:
First, VXN remains around 34, indicating that volatility expectations for tech stocks are still high. Galipeau directly stated that the market will continue to experience violent swings and volatility has not subsided;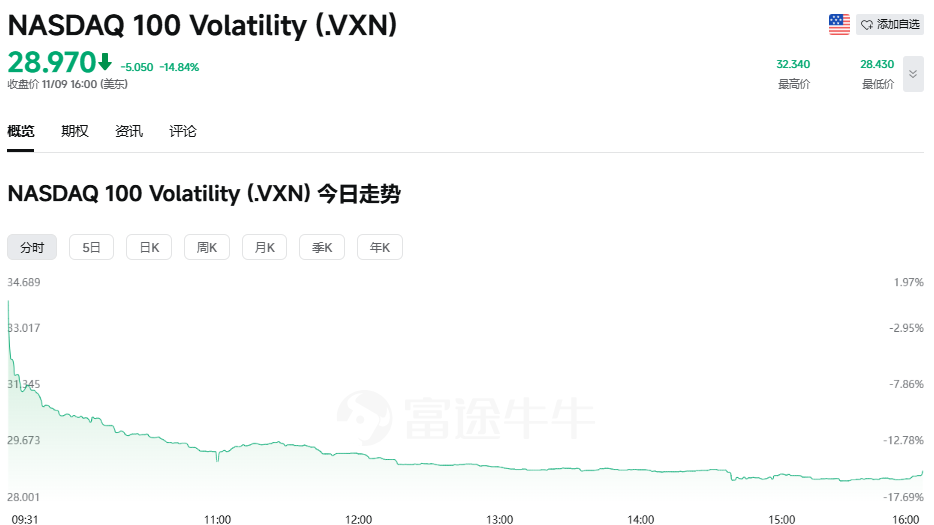
Image: VXN Latest Value 28.97
Second, the CPI data is incomplete this time. Because the 2025 government shutdown caused missing base-period data, the Bureau of Labor Statistics will not release the 12-month year-over-year data for October CPI and core CPI. The market can only look at the month-over-month figures. Economists expect overall CPI to be +0.3% MoM and core CPI +0.2% MoM. Without YoY data, it's equivalent to losing an anchor for judging the major inflation trend. If the MoM figure comes in slightly lower, bulls might shout "inflation is under control," but the YoY level the Fed actually watches is hidden this time. Therefore, Monday's rebound is more accurately described as a sentiment repair in a data vacuum, not a confirmation of a trend reversal.
Conclusion
What's the latest US stock market trend? The Dow Jones had three 1,000-point swings in four days—reversal or bull trap? In our view, three signals need to be monitored: whether VXN materially converges toward 25, whether tech sector outflows decelerate after CPI data lands, and whether the gap between the equal-weighted and cap-weighted S&P 500 stops widening. VIX falling to 20 while VXN remains at 34 indicates that the broad market's "calm" has not covered the most crowded trades. The absence of YoY CPI data while MoM noise is amplified indicates that the data soil for a "bull trap" still exists. It is recommended that before these three signals confirm in the same direction, treating the 1,000-point rebound as a directional conclusion requires bearing a higher-than-normal cost of falsification.
FAQ
Q1: Does a 1,000-point Dow swing represent a trend reversal?
It does not. Dow points are driven by swings in a few high-weight component stocks. Three 1,000-point swings in four days itself only indicates dense volatility and does not convey direction.

Q2: Which is more worth watching, VXN or VIX?
At the current stage, VXN is more worth watching. VIX prices the overall volatility of the S&P 500, while VXN prices the tech stock volatility of the Nasdaq 100. The epicenter of this round's crash and rebound is AI and tech heavyweight stocks. VXN staying at 34 means the options market's pricing of future volatility for the most crowded trades remains very high. Looking only at VIX would underestimate true risk.
Q3: What is the impact of missing YoY CPI data?
The impact is that it amplifies the pricing weight of MoM noise. The absence of YoY data deprives the market of an annual anchor for judging inflation trends, leaving it to rely only on MoM figures. MoM is more susceptible to single-month interference and more easily selectively interpreted as "inflation under control."
Disclaimer: Readers are strictly advised to comply with local laws and regulations. This article is compiled based on public market data for reference and educational purposes only, and does not constitute investment advice. Follow CoinMeta for the latest updates.