












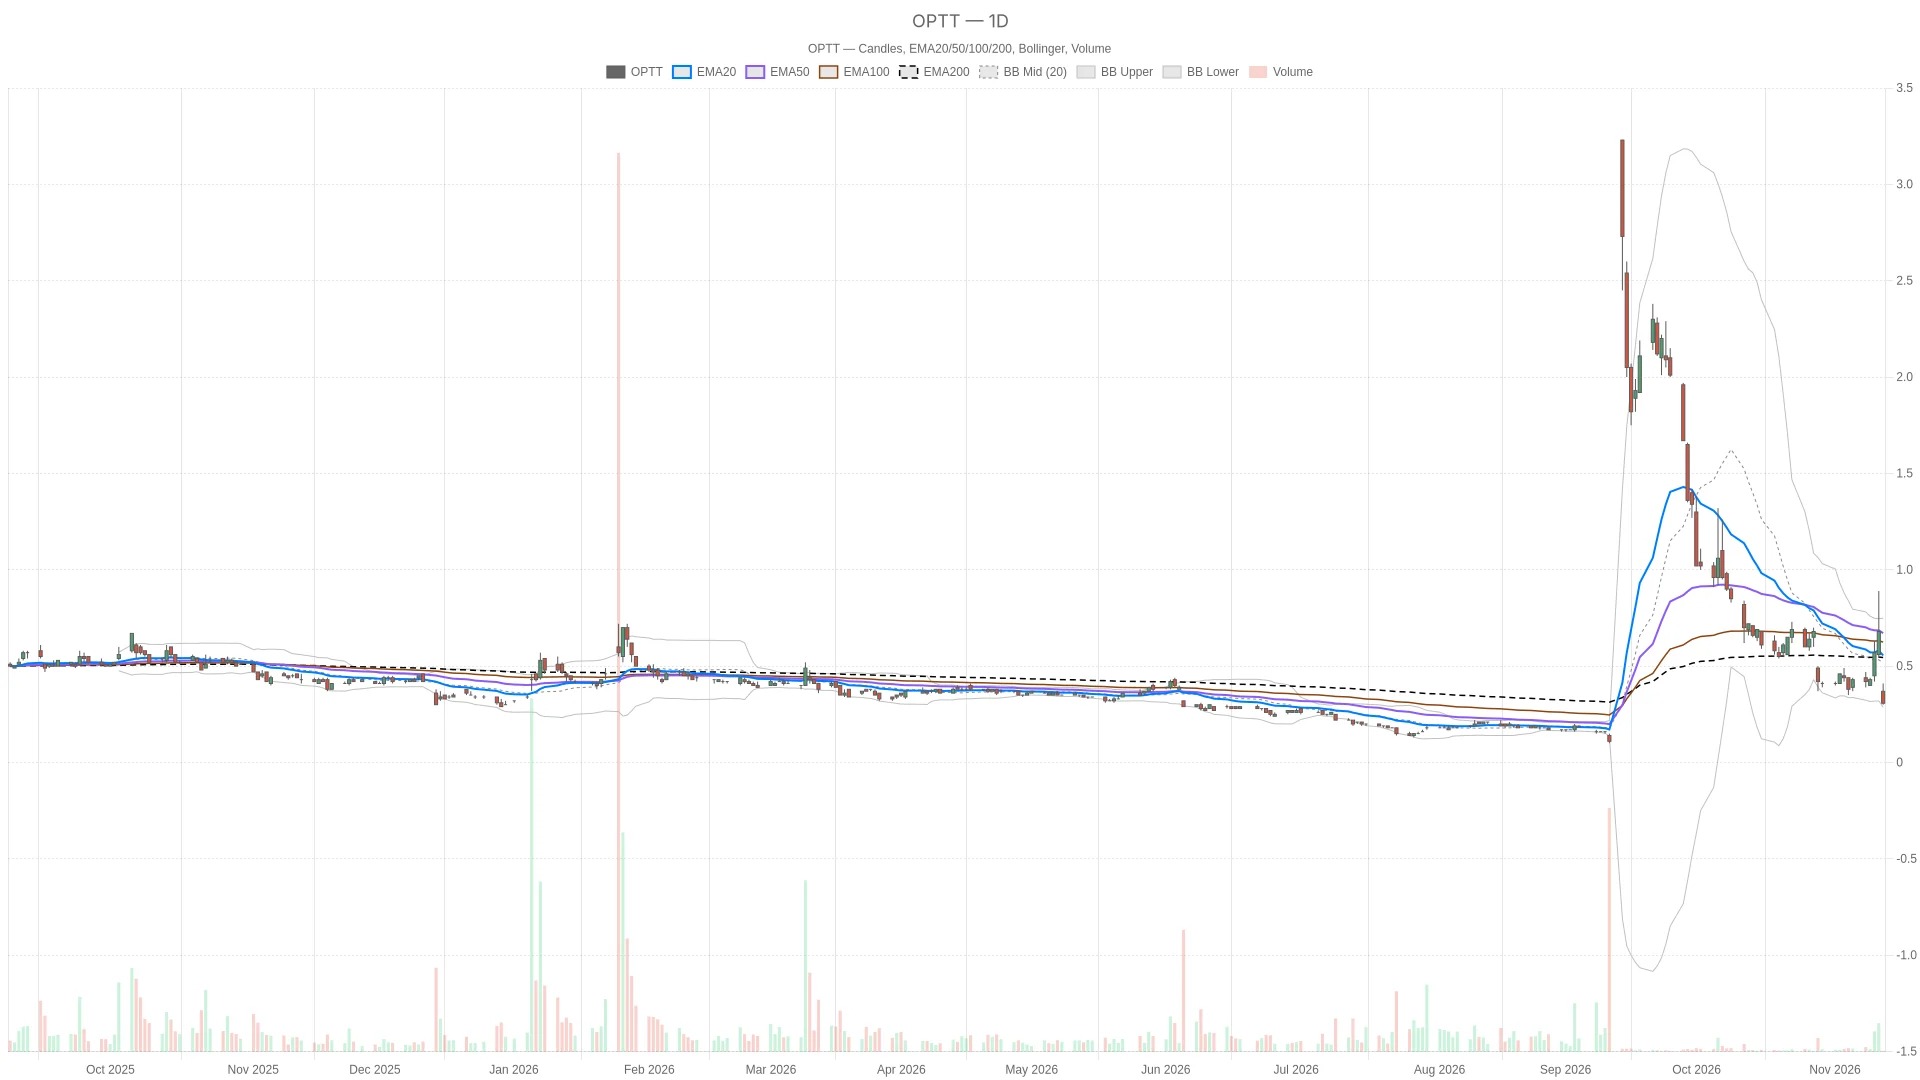
The stock analysis of Ocean Power shows that as of 2:18 PM Eastern Time, the stock price was at $0.31, with a clear bearish tendency. However, the bar chart for MACD indicates a positive trend, with a price of $0.02.

The daily chart of the stock is bearish, with the stock price below the moving average of the major indices and close to the lower band of the daily Bollinger Bands. However, the positive candlestick pattern on the daily chart makes this judgment more complex. The hourly readings support a bearish outlook, and the 15-minute chart has entered an oversold zone, which mainly affects short-term timing decisions.
Abstract
- The daily line RSI14 is at 38.19, below the neutral 50 level, but still above the oversold area.
- On the daily chart, the MACD bar chart shows a positive value of 0.02, while the MACD line shows -0.11, which is higher than the signal line of -0.13.
- The stock price is below the 20-day EMA of $0.56, the 50-day EMA of $0.67, and the 200-day EMA of $0.54.
- Hourly RSI14 is at 34.19; the 15-minute RSI14 is in an oversold state, reporting 24.52.
Ocean Power Technologies opened on Friday, November 13, 2026, at $0.37, and fluctuated between $0.30 and $0.41 during the trading session. As of 2:18 PM Eastern Time, the stock price was reported at $0.31, with trading volume at a level seen so far. Ocean Power started the day at $0.37, with a lowest price of $0.30 and a highest price of $0.41 during trading, and the latest price is $0.31, while the previous closing price was $0.68.
Ocean Power Stocks: Financing News and Bearish Daily Trends
Ocean Power The stock shows a bearish trend on the daily chart, with the price below the moving averages of three major indices and close to the lower band of the daily Bollinger Bands at $0.29. A announcement released by the company before the opening on Friday stated that they had priced a financing deal of $3 million. Another report issued during trading also mentioned warrants, stating that the funds raised are expected to be used for the company's operating activities.
At the same time, the stock price is below the 20-day moving average of $0.56, the 50-day moving average of $0.67, and the 200-day moving average of $0.54. These moving averages do not form a complete bearish pattern, but they are all above the stock price, so the daily chart structure is not favorable for a bullish outlook.
On the daily chart, RSI14 has dropped from 52.5 to 38.19, below the neutral level of 50, but it has not yet entered an oversold zone. In contrast, the daily chart for MACD shows a value of -0.11, which is still above the signal line of -0.13. The positive value column chart has narrowed to 0.02, from a previous value of 0.03. The signal relationship remains constructive, but the MACD line itself is still below the zero axis.
The stock price is between the lower band of 0.29 USD and the middle band of 0.52 USD of the daily Bollinger Bands, and is closer to the lower band. The daily ATR14 has risen from 0.14 to 0.15, indicating a higher absolute volatility compared to the previous K-line. The stock price is also below the first daily support level of 0.52 USD and the daily pivot point of 0.71 USD.
Hourly Confirmation and Short-Term Timing
The hourly readings confirm a bearish trend, with the stock price below both hourly moving averages, and MACD in a negative alignment. On the hourly chart, the stock price is below the 20-hour EMA of $0.48 and the 50-hour EMA of $0.47. The hourly RSI14 is at 34.19, which is lower than the 50-day average but not yet oversold. The MACD line is at -0.02, below the signal line of -0.02, and the bar chart shows -0.04. These readings support a bearish judgment for the daily chart, rather than a constructive relationship indicated by the daily MACD.
It is worth noting that the stock price is also below the hourly first support level of $0.31 and the hourly pivot level of $0.33. At the same time, the 15-minute chart provides a short-term timing reminder: RSI14 is in an oversold state, at $24.52, while both the MACD line and the signal line are at -0.06. The zero bar chart indicates no directional separation. The stock price is below the 15-minute pivot level of $0.31, but it is still above the lower track and the first support level, which is $0.30 for both.
Bullish and bearish conditions
The low point of this trading session at $0.30 is the immediate condition that distinguishes between bullish and bearish scenarios for Ocean Power stock. For the bullish scenario, holding this level is a primary requirement. If the stock can break above the hourly first support level of $0.31, the pivot level of $0.33, and the first resistance level of $0.35, it will strengthen the short-term bullish logic. A more widespread bullish argument would require the stock price to return above the daily first support level and the middle band of the Bollinger Bands at $0.52, followed by breaking above the 20-day EMA level of $0.56.
On the contrary, if it falls below $0.30, the bullish logic based on the support level will become invalid. At that time, the lower band of the daily Bollinger Bands at $0.29 will become the next reference point, followed by the hourly lower band at $0.25.
Overall, the stock of Ocean Power is currently below the hourly support level of $0.31 and also significantly below the daily moving average. The daily moving average of ATR14 is $0.15, indicating that volatility remains a key factor in the assessment. It is still uncertain whether the $0.30 support level can be held; short-term oversold readings do not overturn the bearish structure on the daily chart.
Frequently Asked Questions
Ocean Power What is the daily technical structure of stocks?
The stock presents a bearish daily chart structure. The stock price is below the 0.56 USD of the 20-day EMA, the 0.67 USD of the 50-day EMA, and the 0.54 USD of the 200-day EMA. The daily RSI14 is at 38.19, which is below the neutral 50-level threshold. The daily MACD bar chart still shows a positive value of 0.02, while the MACD line is at -0.11, which is higher than the signal line of -0.13.
What key support levels need to be watched out for?
The low point of 0.30 USD during this trading session is the first support level. Below that, the lower band of the daily Bollinger Bands at 0.29 USD and the hourly lower band at 0.25 USD are the next reference levels. On the hourly chart, the first support level is 0.31 USD, and the pivot level is 0.33 USD.
What conditions are needed for a bullish reversal?
For a bullish scenario, the stock price needs to hold at $0.30 and then break through the first hourly resistance level of $0.35. A more extensive bullish argument requires the stock price to rise above the first daily support level and the middle band of the Bollinger Bands at $0.52, followed by crossing above the 20-day EMA level of $0.56.
Cryptonomist and the author do not hold any positions in the financial instruments mentioned in this text, nor have they received any compensation from the companies reported.
Also please read: AI A Major Agreement Among Superpowers: SingularityNET, Fetch.ai and Ocean Protocol Plans to Come Together Around a Single Token “ASI”
This article was generated with the assistance of artificial intelligence and has been reviewed by an editorial team.
Lorenzo Marcek
Lorenzo Marcek is a financial journalist and senior crypto market analyst, known for his clear, data-driven reporting on digital assets. With a background in economics and over a decade of experience covering global markets, he specializes in on-chain indicators, institutional adoption trends, and macroeconomic factors that influence crypto market volatility. His work combines investigative journalism with technical market insights, making him a trusted source for traders seeking solid and actionable analysis.