


On November 15th, the price of Bitcoin fell to a three-month low of nearly $62,000. The ongoing withdrawal of funds from US spot Bitcoin ETF and large-scale leveraged liquidations put pressure on the cryptocurrency market.
On November 15th, the price of Bitcoin fell to $62,000, with the weekly decline expanding to nearly 15%.
US spot Bitcoin ETF recorded approximately $1.91 billion in capital outflows over seven consecutive trading days.
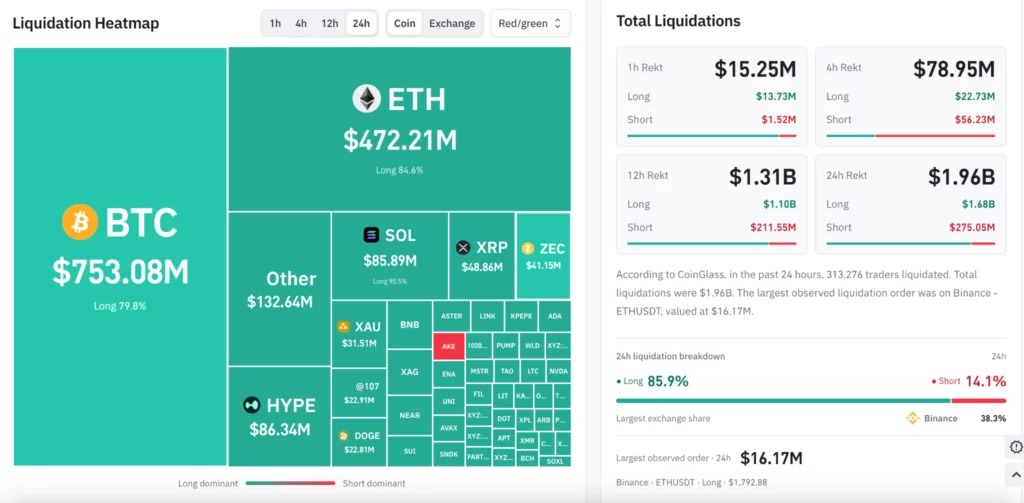
The Bitcoin settlement volume approached $750 million, with long positions accounting for nearly 80%.
Cryptography analyst Micha ël van de Poppe described this round of selling as exceptionally intense, and mentioned that the moving averages have been stretched too far.
The price of Bitcoin is currently finding support around $62,000, while $65,600 and the range between $68,000 and $70,000 remain important resistance levels.
According to the price data from crypto.news, Bitcoin was trading at around $64,500 at that time, and it fell by about 4% within 24 hours, having previously touched a intraday low of around $62,080. This cryptocurrency, known as OG, has seen a cumulative decline of nearly 15% over the past seven days and continued to fall after breaking below $70,000 on Friday.
As the selling pressure continued, Ethereum, XRP, and Solana also recorded further declines.
The decline in Bitcoin prices is due to a流出 of ETF amounting to $1.91 billion.
According to Farside Investors data, US spot Bitcoin ETF recorded approximately $1.91 billion in net redemptions over seven consecutive trading days from November 5th to November 13th.
Prior to this, Bitcoin had already gone through a difficult week. crypto.news As previously reported, in the five trading days up to November 11th, institutional funds withdrew approximately $1.44 billion, and Bitcoin has still struggled to regain its previous trading levels.
Inflation concerns have also increased the pressure on risky assets. In October, consumer prices rose by 0.4%, and core inflation rose by 0.3%. These figures continue to draw market attention to the Federal Reserve's interest rate prospects, with traders worried that borrowing costs may remain at a high level.
Spot Bitcoin ETF is not traded on weekends. The next daily capital flow data will be released after the US market session ends on Monday, November 16th.
Bitcoin settlement approaches $750 million, traders close their long positions
In the total liquidation of Bitcoin, nearly $600.5 million came from long positions, accounting for about 80% of the total liquidation amount. Short positions accounted for $152 million.
When traders who have placed bets on rising prices are unable to maintain the required collateral, a long liquidation occurs. The exchange will automatically close these positions, which may further increase sell orders when prices fall.
Analysts assess the rebound prospects of Bitcoin after an abnormal sell-off
In a post on November 15th, van de Poppe compared the recent three-day decline with rare market events, including the plummet caused by the COVID-19 pandemic and the FTX crash.
He wrote, "This is a super rare pullback driven by leveraged liquidation." van de Poppe indicates that, based on the scale of the decline, he is buying Bitcoin at the current price level.
Doctor Profit still maintains a long-term bullish stance during the downturn. This analyst stated that $57,000 remains the bottom of the bear market for him, and added that only when Bitcoin falls below this level will the sellers be considered truly victorious. Previously, on November 13th, he regarded $68,000 as a potential bottom.
At the same time, Daan Crypto Trades studied the four-year cycles in Bitcoin's history and pointed out that this cryptocurrency has never experienced two consecutive calendar years of decline. He stated that this cycle can still be used as a general historical reference, but the price and timing patterns no longer strictly follow the past patterns.
With the $62,000 support level becoming the focus, Bitcoin price predictions
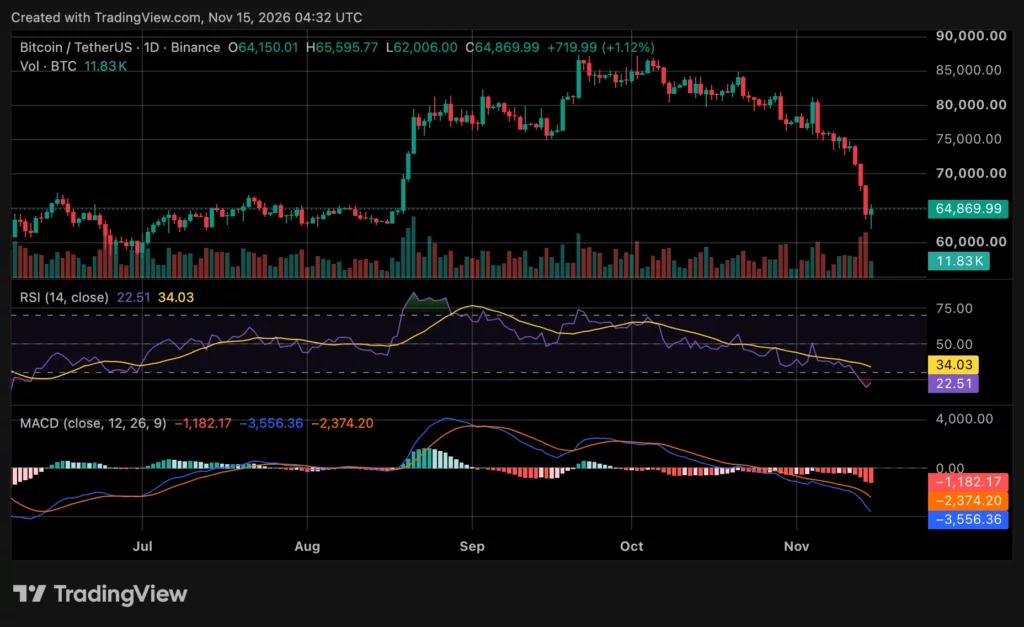
According to previous technical analysis, Bitcoin has fallen below the 200-week moving average, which was around $67,992 on November 14th. Subsequently, this cryptocurrency briefly approached $62,000 before rebounding above $64,000.
The daily chart shows that Bitcoin's Relative Strength Index (RSI) is at 22.51, indicating a state of oversold conditions. However, the Moving Average Convergence Divergence (MACD) indicator is still negative, with a bar chart reading of -1182.17, suggesting that bearish momentum has not yet reversed.
Bitcoin's current direct support level is around $62,000; if selling continues, the next lower support levels are at $60,000 and approximately $59,800. On the upside, resistance levels are around $65,600, followed by the range from $68,000 to $70,000.
If the price reclaims these resistance levels, the short-term structure will improve; if it falls below Sunday's low again, the $60,000 range will once again become the focus of market attention.
Disclosure: This article does not constitute investment advice. The content and materials on this page are for educational purposes only.