

Ethereum fell from around $1,973 to around $1,873 on July 28, a drop of about 5% in a single day. Previously, the price had again encountered resistance in the $1,975 to $2,000 range, failing to break through key resistance levels, and subsequently fell below $1,900, triggering a wave of liquidation of leveraged long positions.
Resistance at $1975 to $2000 again
This pullback erased most of the gains from the previous trading day. ETH had previously risen to its highest level since early June, but buying failed to sustain above the $2,000 mark, putting pressure on bulls who had positioned themselves for a breakout.
After the price fell below $1,900, stop-loss orders and forced liquidations were triggered in succession, and the price once dropped to around $1,873 during the session. Despite the short-term weakness, ETH is still higher than the low of around $1,560 in early July, having rebounded by about 20% from that level.
Long liquidation amplifies the speed of decline.
Derivative positions are believed to have amplified the recent decline. As ETH approached $2,000, the market accumulated a significant amount of bullish leveraged positions; when spot buying failed to push prices higher, these positions quickly turned into selling pressure.
A weekly liquidation heatmap shows that ETH has traversed several areas of high leverage in the $1950-$1890 range, and forced liquidations could further increase sell orders. Currently, greater downside liquidity is concentrated around $1840-$1850, making this area a key level to watch.
Furthermore, large-scale transfers of ETH from wallets to centralized exchanges could also increase short-term selling pressure. The report also noted that the overall weakness in tech stocks suppressed the performance of risk assets, and market concerns about the high returns on AI investments increased global stock market volatility and dragged down sentiment towards crypto assets.
$1840 to $1870 becomes the short-term focus
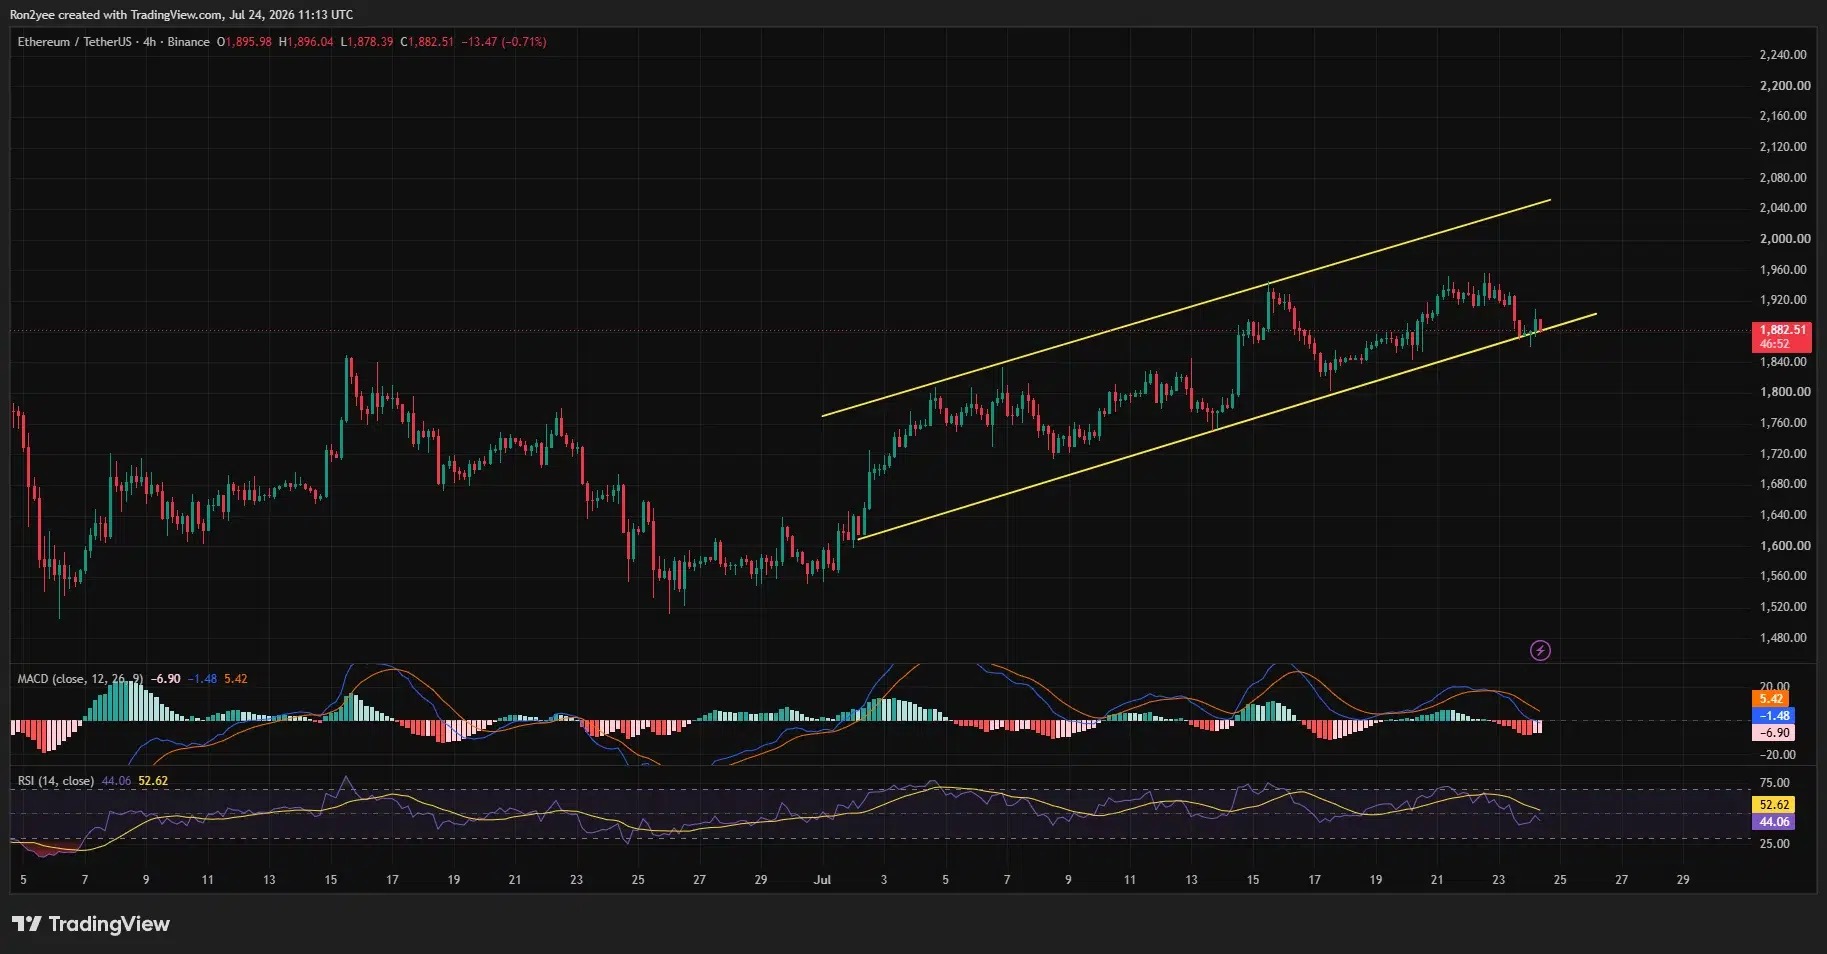
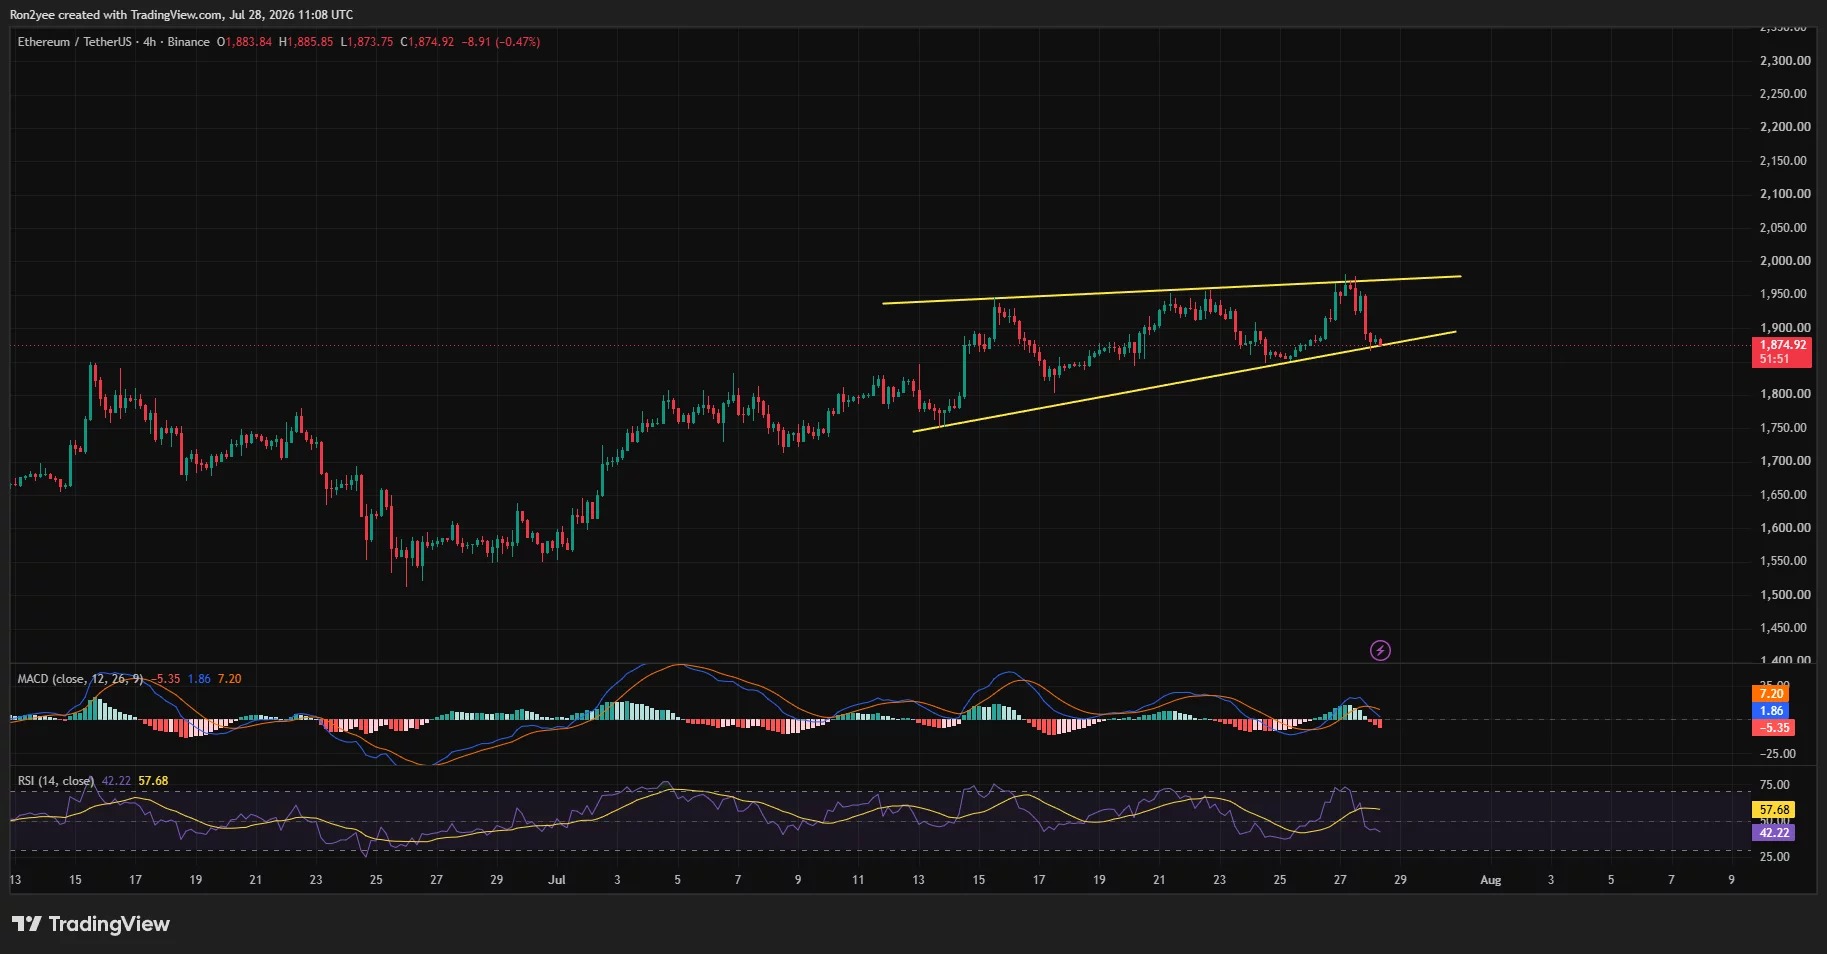
On the 4-hour chart, ETH is testing the lower edge of a rising wedge near $1870. This trendline has supported the rebound since mid-July, making the current area crucial for the short-term direction.
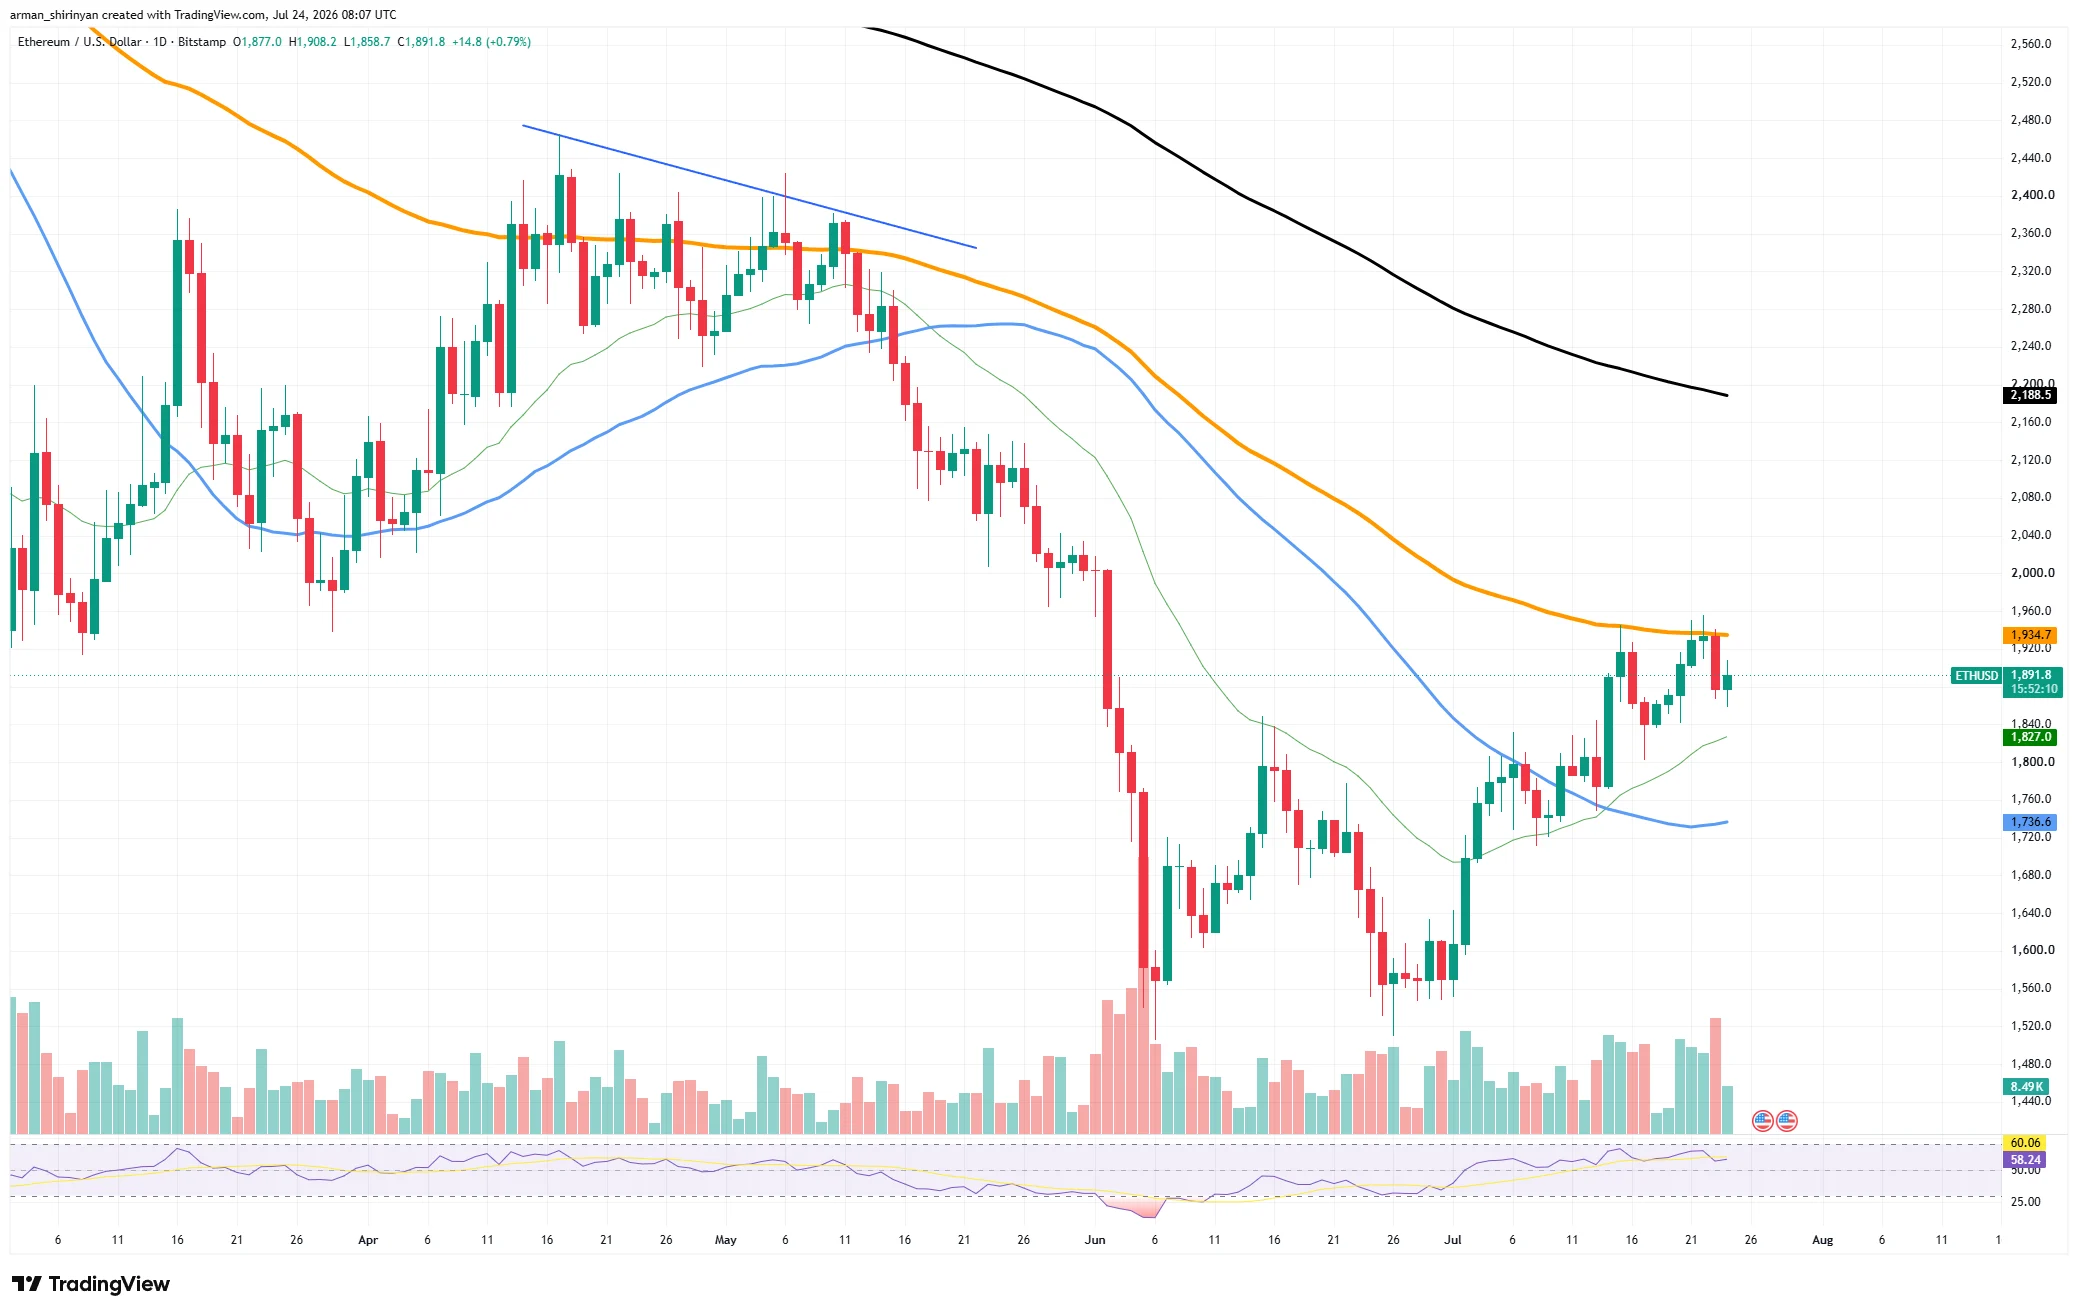
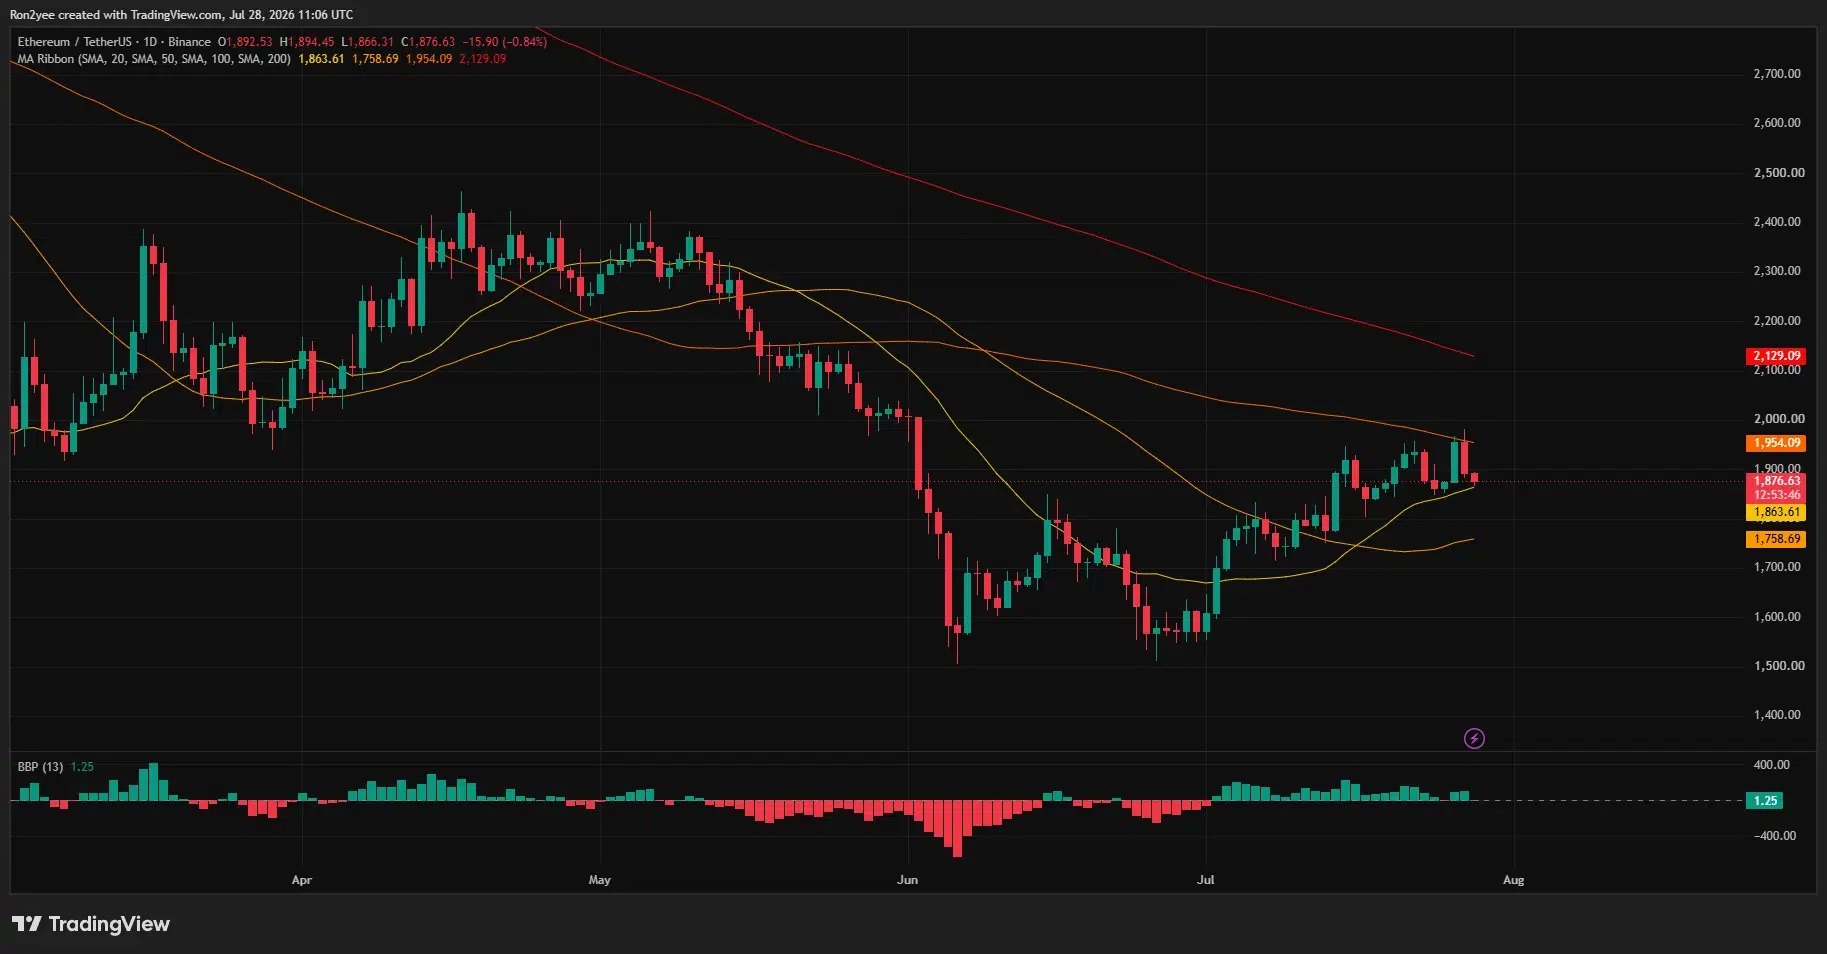
If the price breaks below this support level, the next key area could move down to $1850-$1840; if this range is breached, the market may further focus on the 100-day moving average around $1758. On the daily chart, the 20-day moving average around $1864 continues to provide nearby support.
Looking at the upside, ETH needs to first recover $1900, then it will still face resistance in the $1950-$1975 range. This area is also close to the recent high and the 200-day moving average around $1954, where selling pressure is relatively concentrated.
Some analysts consider $1840 a key support level. Other market observers noted that corporate buying could support medium- to long-term demand; for example, BitMine added nearly 10,000 ETH last week. However, with crowded leveraged positions, such buying is unlikely to completely offset short-term volatility, and the market will continue to focus on whether the $1840-$1870 area can hold.