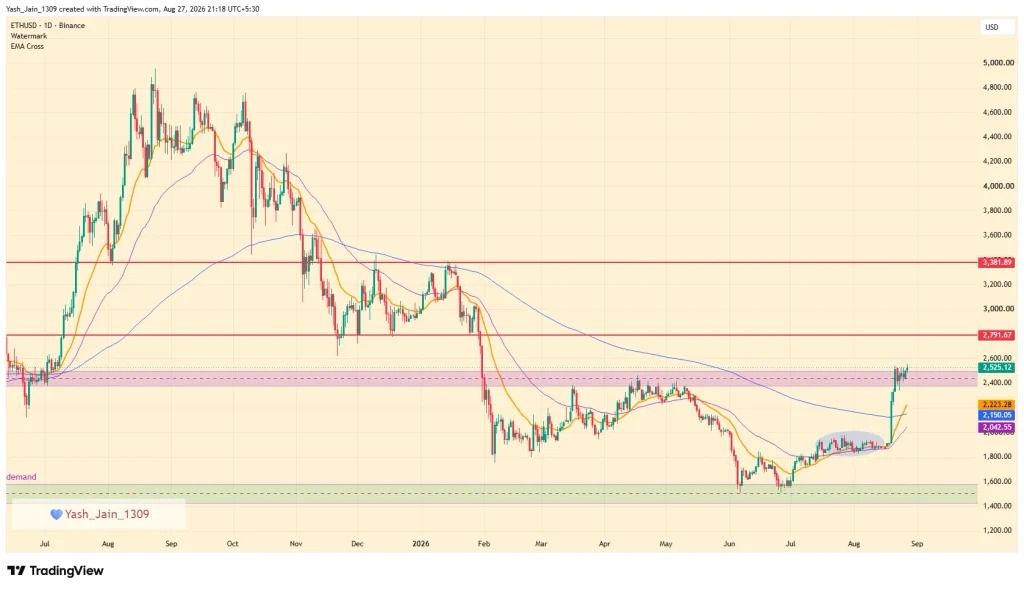


Foreign media analysis suggests that since ETH rebounded from around $1510 on June 15, it has risen to $2535, completing a breakout from the previous double-bottom pattern. The article argues that the price structure is now stronger than before, but the range between $2383 and $2495 remains the most important short-term test at present.
Exchange balances continue to decline.
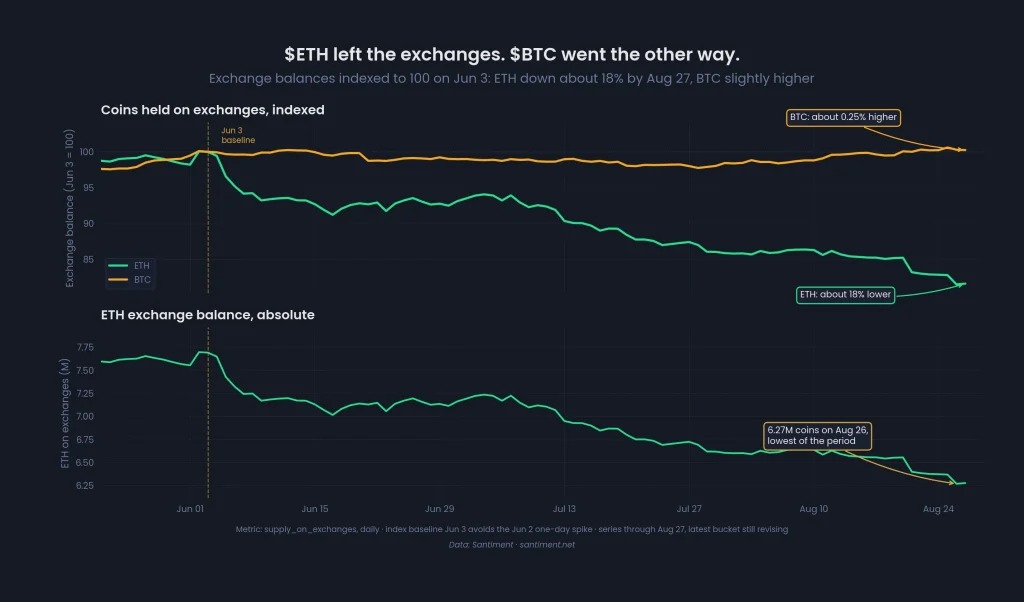
In addition to price trends, changes in on-chain supply have also drawn attention. Data shows that since June 3rd, the balance of ETH within exchanges has decreased from approximately 7.69 million to 6.28 million, representing a reduction of about 18%.
The article mentions that this outflow has not stopped due to the recent increase in price. After August 19th, approximately 275,000 ETH were transferred out of the exchange, bringing the balance to a low point for this period. During the same time, ETH has risen by about 27% since August 16th, indicating that even as prices increased, the inventory on the exchange continued to decrease.
In contrast, the balance of Bitcoin exchanges has increased slightly by about 0.25% in the past 12 weeks, showing a different trend from ETH.
The range from $2,383 to $2,495 marks a short-term dividing line.
The article suggests that ETH is currently undergoing repeated tests in the range of $2,383 to $2,495. Previously, this area was more akin to a resistance zone above. If the price can stabilize above this range and turn it into support, there is a possibility of further upward movement in September.
According to the analysis in the text, if the buying trend continues, attention can be paid to the levels of $2,791 and $3,381 in the future. On the contrary, if this current range is lost, the price may fall back to around the 200-day moving average, which is approximately $2,150.
Strong signals coexist with signs of overheating
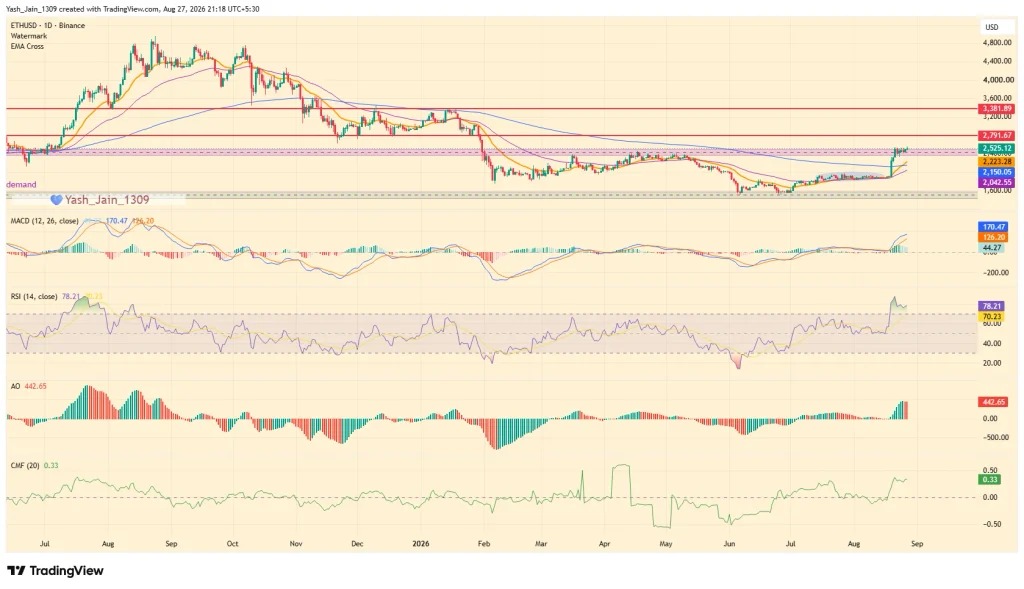
In terms of technical indicators, the article mentions that the 50-day and 200-day exponential moving averages have formed a 'golden cross', and MACD as well as AO are also improving, indicating that the upward momentum is still strengthening.
However, the signals of short-term overheating are also evident. The Relative Strength Index RSI has risen to 78.05, and the Money Flow Index CMF is around 0.33, both of which are at relatively high levels. Based on this, the article suggests that if ETH is to continue to rise, it may need to go through a period of cooling down first.
Overall, this comment considers the range of $2383 to $2495 as the key observation zone for the next phase of ETH. If the price can hold within this range and at the same time the exchange balance continues to decline, market expectations for further upward movement may be further strengthened.