Foreign media analysis indicates that the Injective token INJ was trading at $4.88 on September 1st, still within the middle of the fluctuation range seen in recent weeks. There is no clear trend on the daily chart, but the hourly trend is weak, and the on-chain spot transaction fees have also declined accordingly, making the market more cautious about the support level in this range.
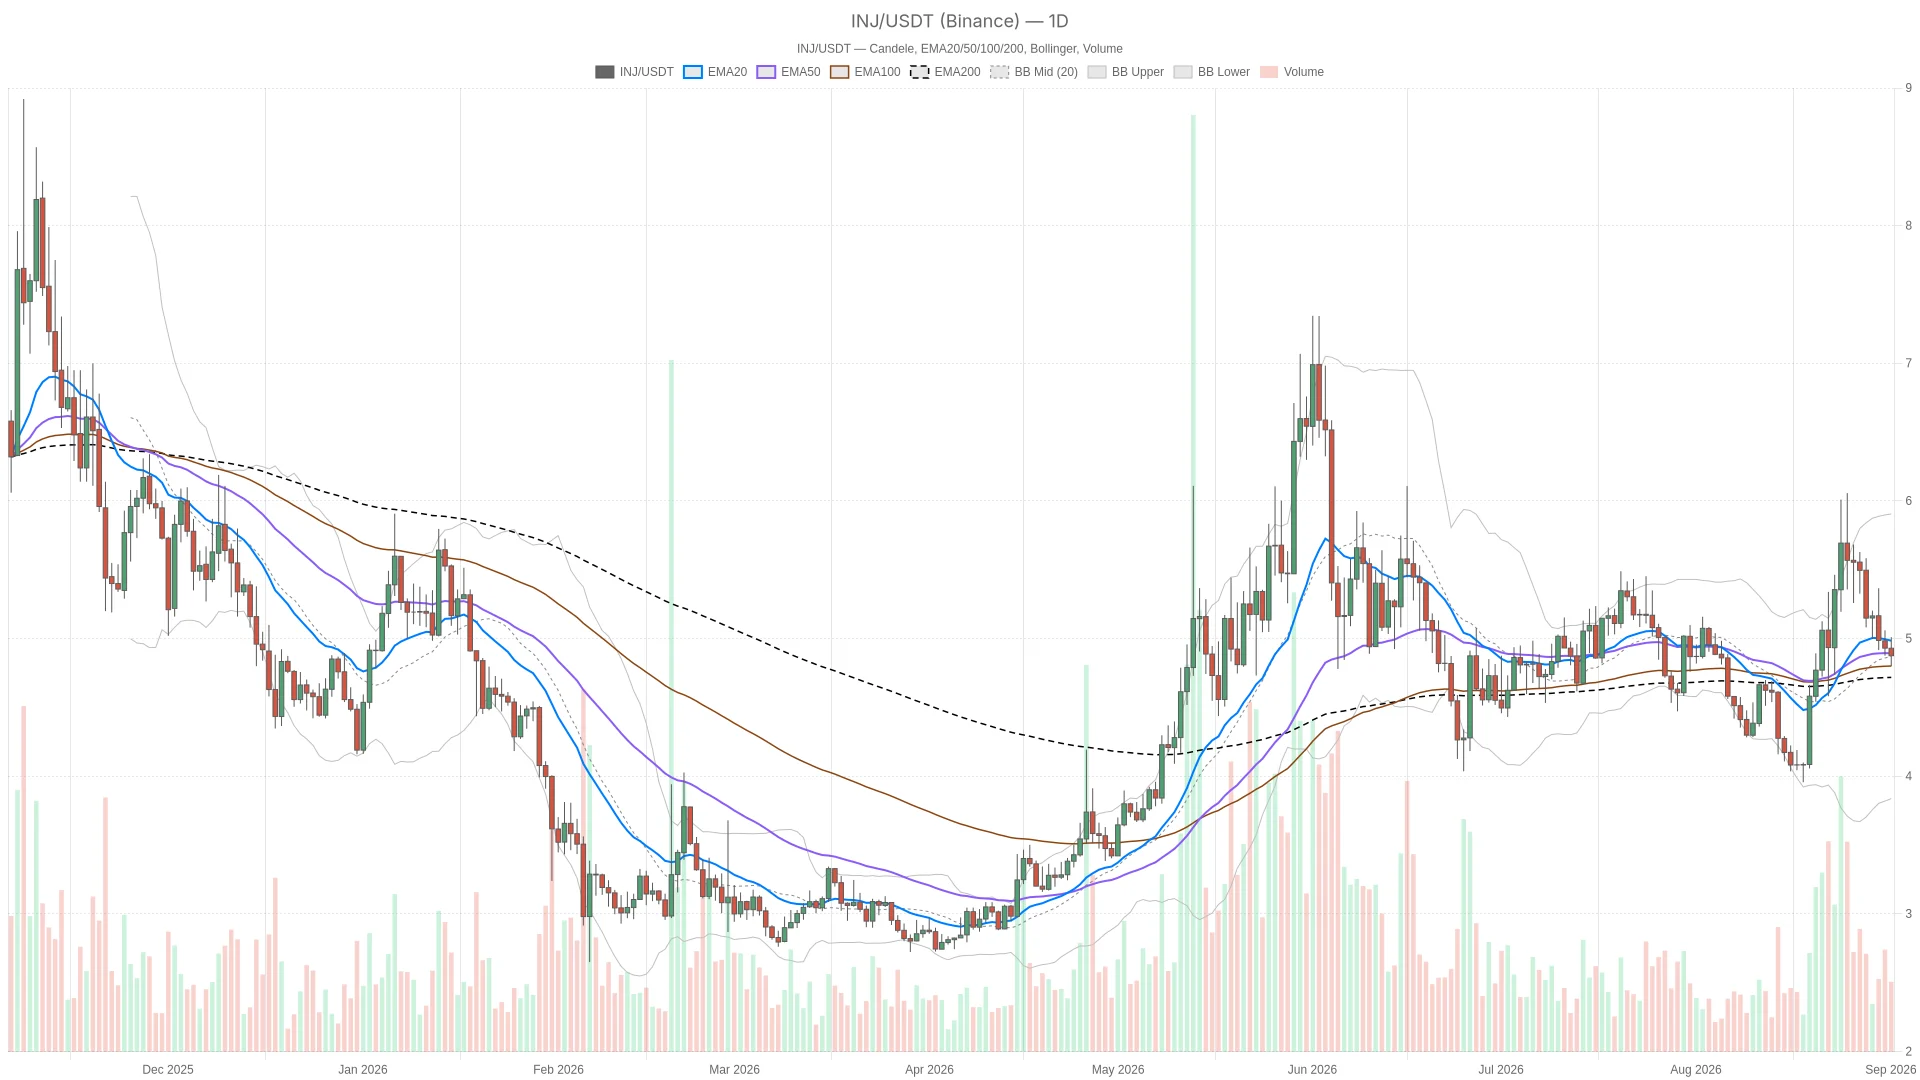
The daily chart is still operating within the range.
From a daily perspective, the price of INJ is sandwiched between the 50-day moving average of $4.89 and the 20-day moving average of $4.98, with the 200-day moving average at $4.72. The Relative Strength Index (RSI) of RSI is at 48.23, indicating a temporary balance of bullish and bearish forces.
The article mentions that the key observation range for the daily chart is concentrated between $4.78 and $4.99. If the price breaks above $4.99, market sentiment may strengthen; if it falls below $4.78, the pressure for a decline will increase significantly.
Short-term trend is weak.

After switching to the 1-hour chart, INJ remains below the 20-hour, 50-hour, and 200-hour moving averages, indicating a bearish short-term trend. The 15-minute chart shows a similar pattern, suggesting that buying momentum in the short term is still weak.
However, the article suggests that the current situation is more akin to a consolidation at lower levels rather than a rapid decline. The support and resistance levels at the 15-minute time frame are very narrow, indicating that prices are contracting in volatility, waiting for new catalysts to emerge.
On-chain transaction fees have significantly cooled down.
In addition to price trends, on-chain data also indicates a relatively cautious outlook. Injective Spot fees have decreased by 70.38% in the past 24 hours, 88.36% in the past 7 days, and 44.83% in the past 30 days.
The article argues that this indicates a slowdown in the activity of the core transaction scenarios of the protocol. If prices remain sideways, but real transactions and transaction fees continue to decline, the market will pay more attention to whether the current prices are still supported by sufficient demand.
Pay attention to the breakout direction of the range.
Overall, this review article suggests that the INJ daily chart remains neutral, but the 1-hour and 15-minute timeframes have shown weakness. The decline in on-chain fees has further increased short-term pressure.
Next, the range of $4.78 to $4.99 remains the most noteworthy. If the price breaks through upwards, it is necessary to see a simultaneous repair of the short-term structure; if it falls below this range, the market may continue to seek lower support levels.