

Chainlink disclosed at the beginning of September that the US Department of Commerce is utilizing its network to bring some macroeconomic data onto the blockchain. This adds new real-world application scenarios to the project. Meanwhile, LINK's holdings on exchanges have been continuously declining over the past three months, and the market is also paying attention to whether changes in token supply will continue to affect price performance.
US Department of Commerce data integrated onto the blockchain
According to the information published by Chainlink, the data included this time encompasses the actual GDP and PCE price indices, as well as indicators such as the actual final sales amounts of private domestic purchasers. This indicates that the scope of use for Chainlink is expanding from its original use in encrypted scenarios to the distribution of government economic data.
Such data is generally considered an important reference for macro-level observations. For Chainlink, the addition of new government data access helps to enhance the practical use of its oracle network and also allows the market to re-evaluate its adoption progress.
Exchange holdings decreased by 20 million coins in three months.
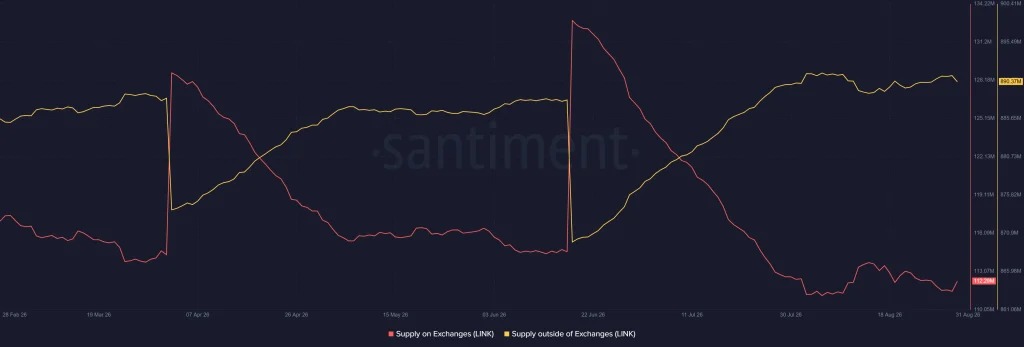
On-chain supply changes are another focus of the recent performance of the LINK market. The article mentions that over the past three months, the number of LINK coins within exchanges has decreased from 132 million to 112 million; during the same period, the holding amount outside of exchanges has increased from 870 million to 890 million coins.
- Exchange holdings decreased from 132 million to 112 million coins.
- Holdings outside of the exchange: increased from 870 million to 890 million coins
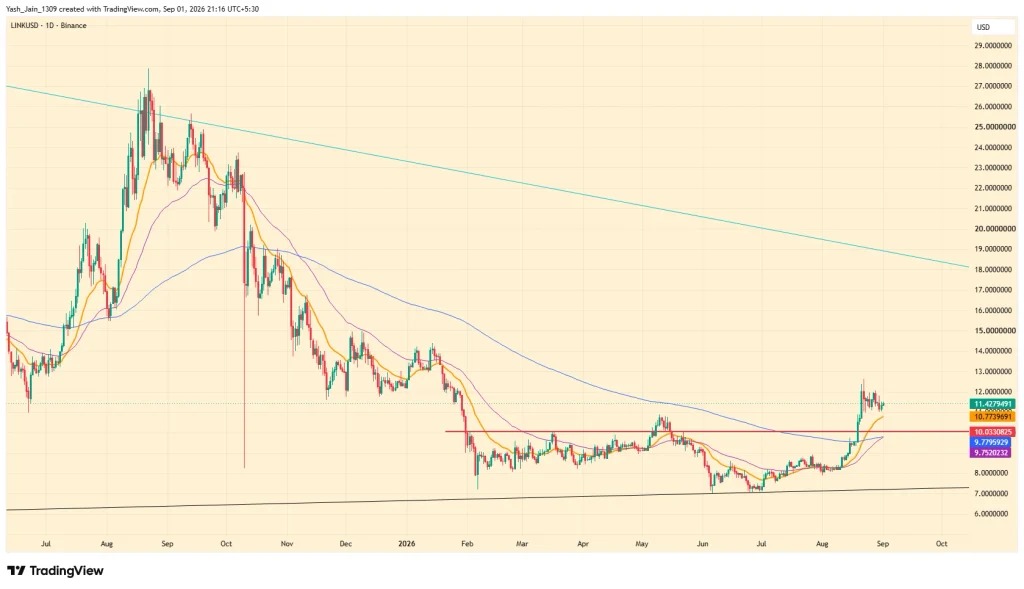
- Price range: around $7.2 in July, around $12.4 at the end of August.
This set of changes usually indicates that more tokens are transferred out of the trading platform, resulting in a reduction in short-term supply and selling pressure. During the same period, the price of LINK also rebounded from around $7.2 in July, rising above $12 by the end of August, and then consolidated in that range.
The market is focusing on the range between $18 and $10.
In addition to the supply changes, the article also mentions that the 50-day moving average of LINK has crossed above the 200-day moving average, forming a pattern commonly referred to in the market as a "golden cross." This signal is generally regarded as one of the signs of an improvement in the medium-term trend.
If buying pressure continues to strengthen, LINK may subsequently test the $18 range; this level is also close to a downward resistance line that has persisted for many years. If selling pressure strengthens again, prices could fall back to around $10; once this level is lost, the market may further focus on the $7 area.
Overall, Chainlink has recently seen two changes: an expansion in applications and a decline in the existing volume on exchanges. However, whether these factors can continue to translate into sustained buying pressure remains to be verified by the market performance in September.