

Bitcoin recorded a gain of nearly 25% in August and once again surpassed the 50-month moving average, with market sentiment clearly improving as a result. However, entering September, the price slowed down below a key resistance level, and the strong rebound began to face the dual challenges of seasonal factors and macroeconomic expectations.
The market is still betting on an upward trend.
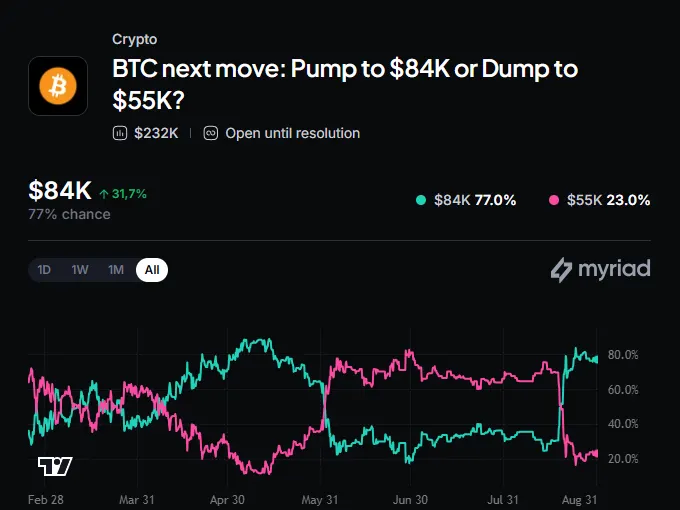
On September 1st, Bitcoin fell from $78,571 to around $77,440, a decrease of about 1.3% within the day. According to the data from Myriad Markets, traders estimate that the probability of it first rising to $84,000 and then falling to $55,000 is about 77%.
This bet continued the optimistic sentiment that followed the rebound in August. Previously, the U.S. Treasury Department expanded the scale of long-term government bond repurchases, which led to a decline in U.S. Treasury yields; the U.S. Securities and Exchange Commission (SEC) also advanced regulatory frameworks for crypto investment contracts, providing additional support for the market.
$81,455 to $82,538 forms a resistance zone
From a daily perspective, Bitcoin is still constrained between the range of $81,455 and $82,538. The Relative Strength Index RSI is at 66.1, which is still in a relatively strong zone, but it has approached the common profit-taking area; the Average Directional Index ADX is at 43.7, indicating that the current trend still has strength.
However, the 50-day and 200-day exponential moving averages remain in a bearish crossover, indicating that although prices have rebounded significantly, the longer-term trend structure has not yet fully strengthened. The article mentions that this gap between the moving averages is narrowing, but no clear reversal signal has yet been formed.
Still encountering a weak season in September even after the monthly chart has been corrected.
Looking at a longer period, the monthly chart in August once again crossed above the 50-month moving average, which is seen as an important change marking the end of the previous downward phase. In the past, Bitcoin's price fell below this moving average mainly during the bear market from 2018 to 2019, as well as during the downward periods following the Terra, LUNA, and FTX events in 2022.
However, the monthly indicators have not yet fully confirmed a new upward trend. The monthly RSI is at 50.6, and the monthly ADX is at 23.7, which is still below the common levels for confirming a trend. At the same time, September has historically been one of the months when Bitcoin performs weakest. The increasing expectations of interest rate hikes before the Federal Reserve's September meeting also add pressure to the short-term trend.
- Resistance above: $81,455 to $82,538
- Support range below: $73,670 to $75,157
- Lower support level: $68,858