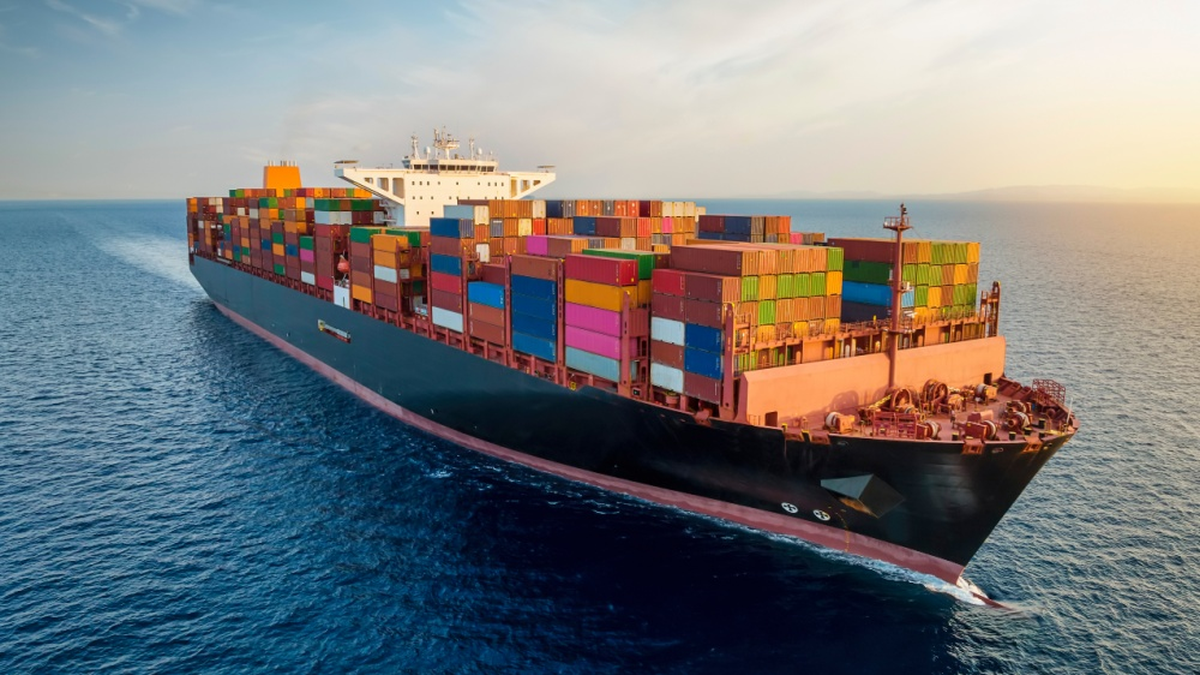
The trade and transportation data for 2025 released by Eurostat on September 24 reveals two aspects of the EU's foreign trade. By weight, maritime transport accounts for 73.3% of non-EU imports and 72.6% of exports; however, when measured by value, this share drops to 50.2% for imports and 40.4% for exports. In other words, ports and ships carry the vast majority of physical goods, but they do not carry an equivalent proportion of the value of those goods. This discrepancy will directly affect how policies are evaluated in terms of disruptions to shipping routes, port congestion, and the impact on freight rates.
In 2025, the European Union imported 1.1 billion tons of goods from non-EU countries by sea, worth 1.27 trillion euros; it exported about 500 million tons by sea, worth 1.069 trillion euros. The discrepancy between weight and value is not contradictory. Energy, ores, food, and bulk raw materials are large in volume and relatively low in unit value, making them naturally suitable for maritime transport; high-value-added products that are time-sensitive can be transported by air, contributing a significant amount with much less weight.
Sea freight is for bulk supply, while air freight is ideal for high-value and time-sensitive goods.
Air freight accounts for only 0.3% of import weights and 2.9% of export weights, yet it constitutes 20.7% of import values and 29.1% of export values, respectively. Goods with high value and critical delivery times, such as chips, pharmaceuticals, precision instruments, and luxury items, are more likely to be transported by air. If one considers only tonnage, air freight might seem negligible; however, when it comes to key components and a company's cash flow, air freight can be decisive in whether a production line can operate on time.
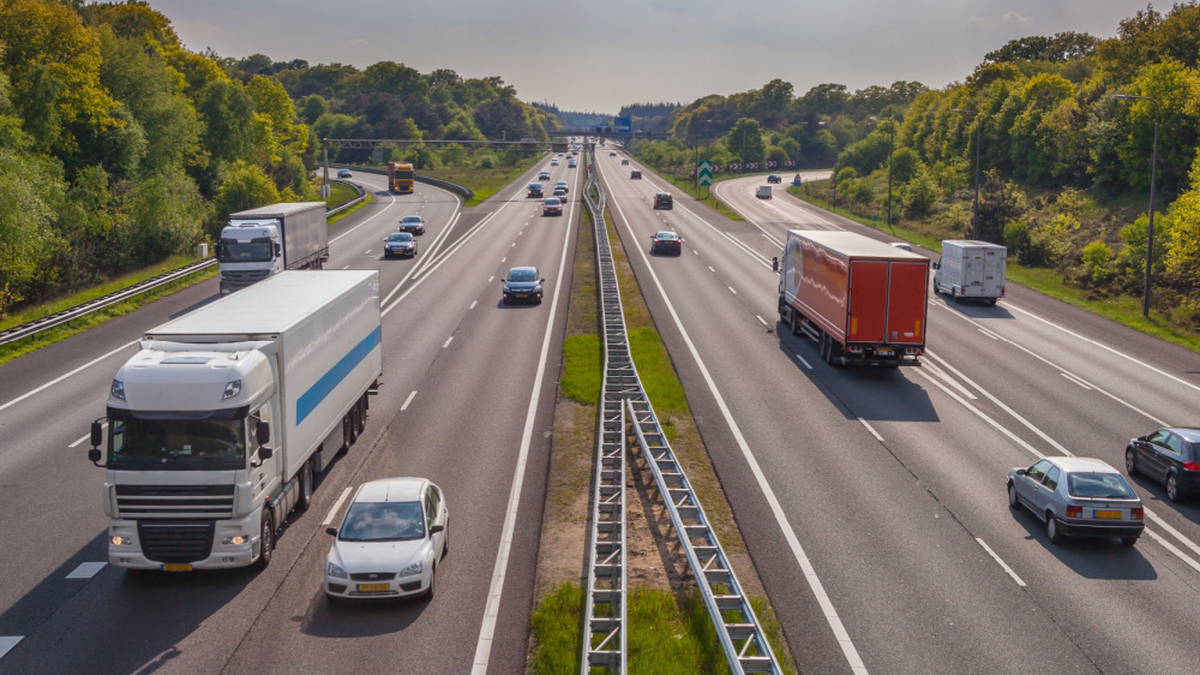
Highways also show similar but milder differences: accounting for 6.0% of the import weight and 19.5% of the value, and 17.4% of the export weight and 24.9% of the value. Road trade between the EU and neighboring countries, as well as short-distance, high-frequency replenishment operations and cross-border manufacturing networks, rely heavily on trucks. The situation for railways is the opposite; imports and exports account for only 2.6% and 2.9% of the weight respectively, and 1.2% and 1.3% of the value, with railways mainly carrying bulk goods of lower unit value.
These ratios remind companies that supply chain risks cannot be ranked solely by total amount. A certain raw material may not have a high value, but it is a fundamental input that all factories rely on; a small batch of aviation parts may weigh very little, yet they could block the delivery of high-value products. Risk assessments should take into account weight, cost, alternative routes, inventory days, and potential losses due to production halts.
Highly concentrated maritime transport also exacerbates infrastructure constraints. Congestion at any point, such as port berths, waterways, containers, railway connections, or customs processing, can lead to delays in the shipment of large quantities of physical goods. In contrast, although it is more costly, it is feasible for companies to temporarily switch a small amount of high-value goods to air transport; however, it is almost impossible to quickly replace millions of tons of crude oil or ore with any other method.
Trade resilience is not about abandoning maritime shipping, but about preparing alternative routes for key nodes.
Sea transportation has low costs and large scale, making it an irreplaceable foundation for global trade. It is not practical to shift a large volume of goods to road, rail, or air transport, as this could also lead to increased emissions. A more feasible approach is to identify key ports, straits, and suppliers, and to establish multi-port access, moderate inventory levels, and alternative contract arrangements for critical commodities, rather than attempting to evenly distribute all goods across various modes of transport.
The data also indicates that the transmission of transportation disruptions to macroeconomic indicators varies. Delays in energy and raw materials will first affect industrial output and prices; disruptions in high-value air freight may rapidly impact export revenues and corporate orders; while road obstructions are more likely to be reflected in retail restocking and cross-border parts shipments. Central banks and fiscal authorities need to consider the mode of transportation to determine whether the impact will mainly fall on inflation, growth, or the trade balance.
There are also limitations in the statistical methodology here. The Eurostat data covers international trade in goods between EU and non-EU countries, which is not equivalent to the internal trade between member states; the weight and value shares are annual aggregates and cannot directly reflect the congestion levels of a particular month. The mode of transport is usually recorded based on the primary method used when the goods cross external borders, but the actual logistics chain may also include multiple connections such as trucks, railways, and warehousing.
From a corporate perspective, what is most worthwhile is to map these macro-proportions to one's own procurement list. Which raw materials can only be transported by sea, which parts can be airlifted in emergencies, which suppliers rely on the same port, and who will bear the insurance and freight terms – these questions are more useful than simply judging whether the proportion of sea transport is high or not. The resilience of the supply chain ultimately comes down to the management of specific goods and specific nodes.
Environmental policies also need to distinguish between total volume and efficiency. Maritime transport carries a large weight, and its emissions per ton-kilometer are generally lower than those of air and road transport. However, issues such as ship fuel, port air quality, and investment in alternative fuels remain important topics. If a large amount of cargo is shifted to higher-emitting modes in order to avoid risks, new costs may arise. Diversification of transportation methods needs to be designed in conjunction with energy efficiency and emission reduction targets.
The financial and insurance markets also amplify the differences in modes of transportation. When the risks associated with shipping routes increase, insurance premiums for ships, war risks, and freight rates may rise first, before affecting import prices. Although air cargo is of high value, the transportation time is shorter, meaning companies require less working capital during transit. For enterprises facing higher interest rates and tight cash flows, having cargo remain at sea for an additional two weeks is not only a logistics issue but also increases operating costs. Therefore, trade resilience assessments should also take into account transportation times and financing conditions.
Port data can provide more timely supplementary information for annual statistics. If the number of ships calling at ports, waiting times, container turnover rates, and congestion in railway connections all deteriorate at the same time, these issues often reveal pressures earlier than the annual trade figures do. Enterprises do not need to wait until the official annual data is released to adjust their inventory, but they should avoid drawing conclusions about the overall European trade trends based on a week's fluctuations at a single port.
Eurostat What can be confirmed from this data is that maritime transport continues to control the physical infrastructure of EU foreign trade, while air and road transport are far more important in terms of value of goods than in terms of tonnage. If policies and businesses only measure risks based on trade amounts, they will underestimate the dependence of bulk goods on ports and shipping routes; if they only consider weight, they will overlook the impact of a small amount of high-value goods on output and profits. Only by using both sets of metrics simultaneously can we get a closer approximation of the real supply chain.