

Bitcoin once rose above $87,000 this week before pulling back, falling to around $83,000 on September 25th, and the market has re-entered a period of narrow consolidation. Traders are currently focusing on the expiration of quarterly options, the rise in U.S. Treasury yields, and the funding situation for spot Bitcoin in the United States.
After a short-term pullback, it holds its position in the key range.
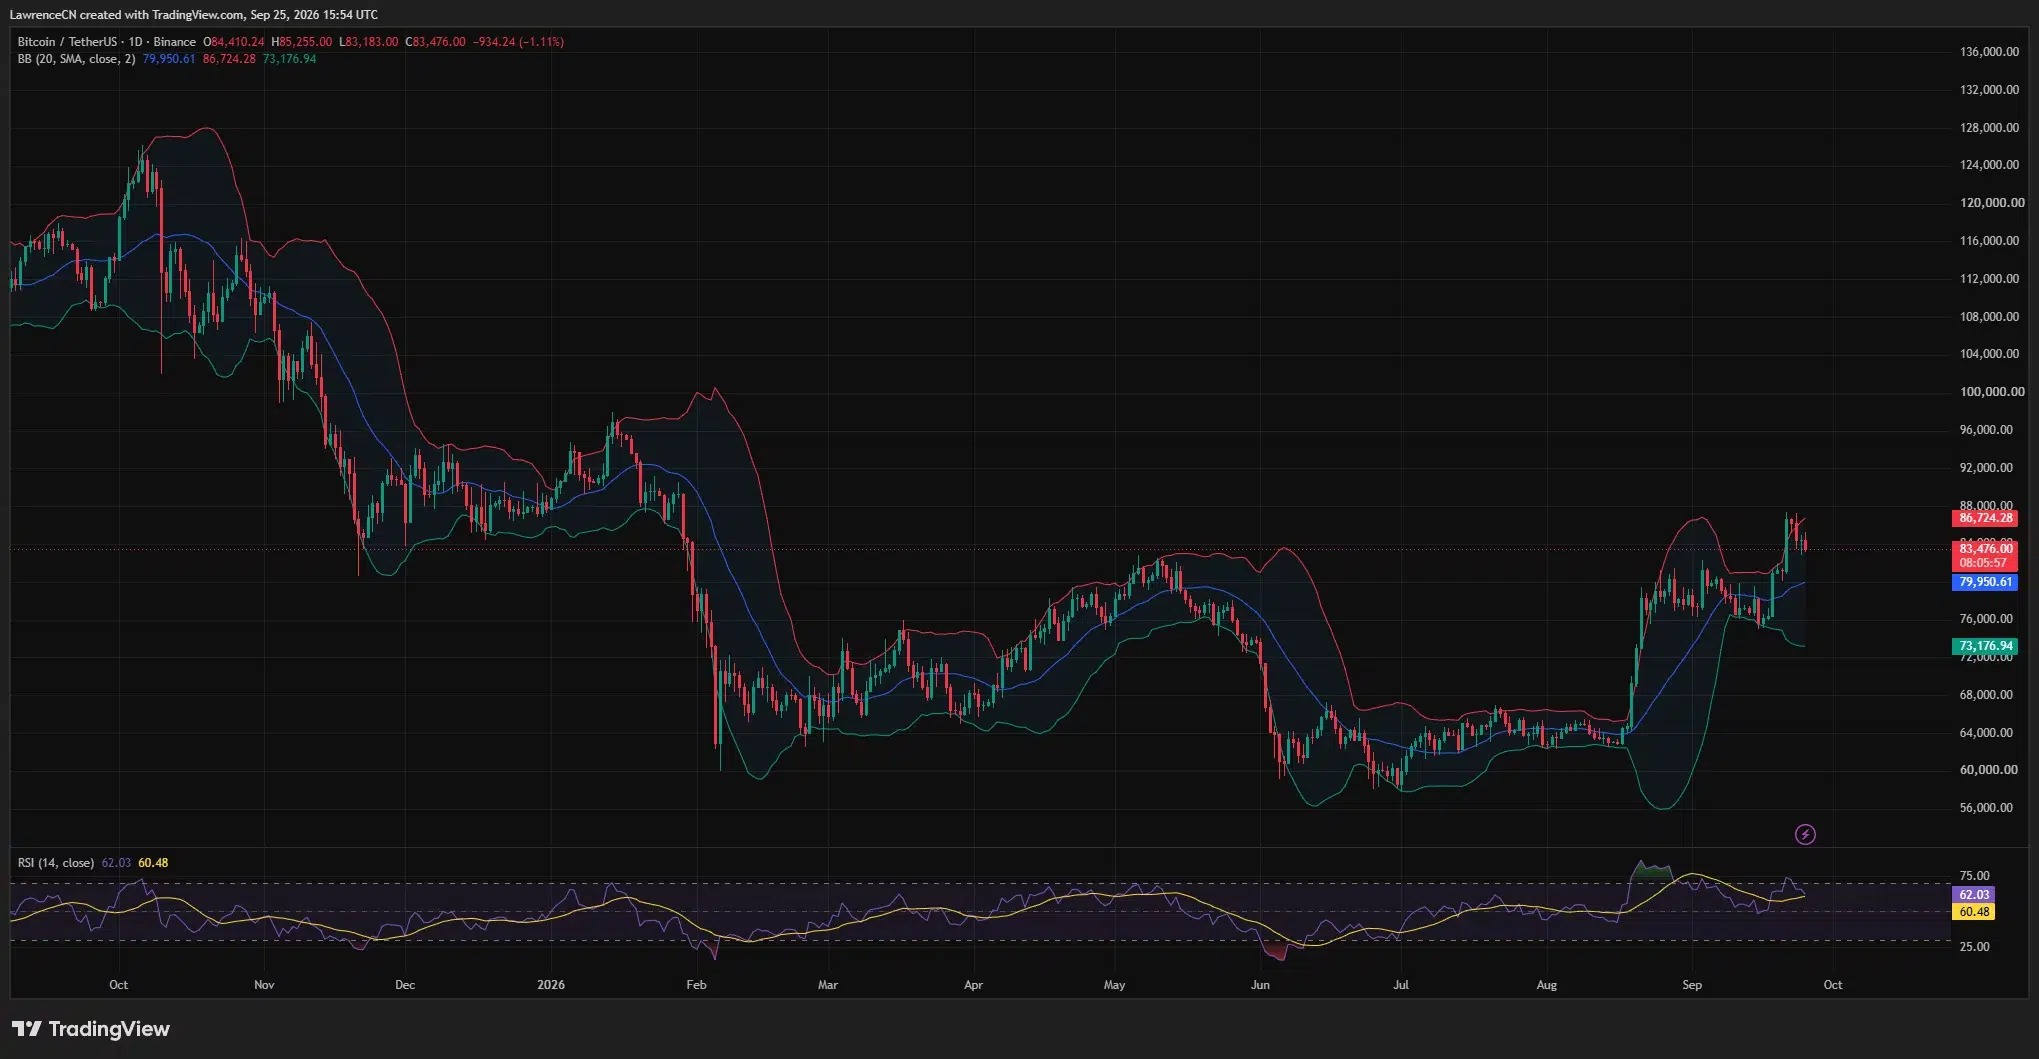
As of midday on that day, the price of Bitcoin was around $83,476, with a daily decline of about 1.1%. The previous round of gains began below $76,000, and then the price soared rapidly, but there are already signs of a slowdown in short-term momentum.
From a daily perspective, Bitcoin is still operating above the middle band of the 20-day Bollinger Bands, which is around $79,951. The Relative Strength Index RSI has fallen to 62.03; although it is below the high levels during the upward trend, it remains above the neutral line of 50, indicating that the bullish structure has not been completely broken.
4-hour momentum weakening
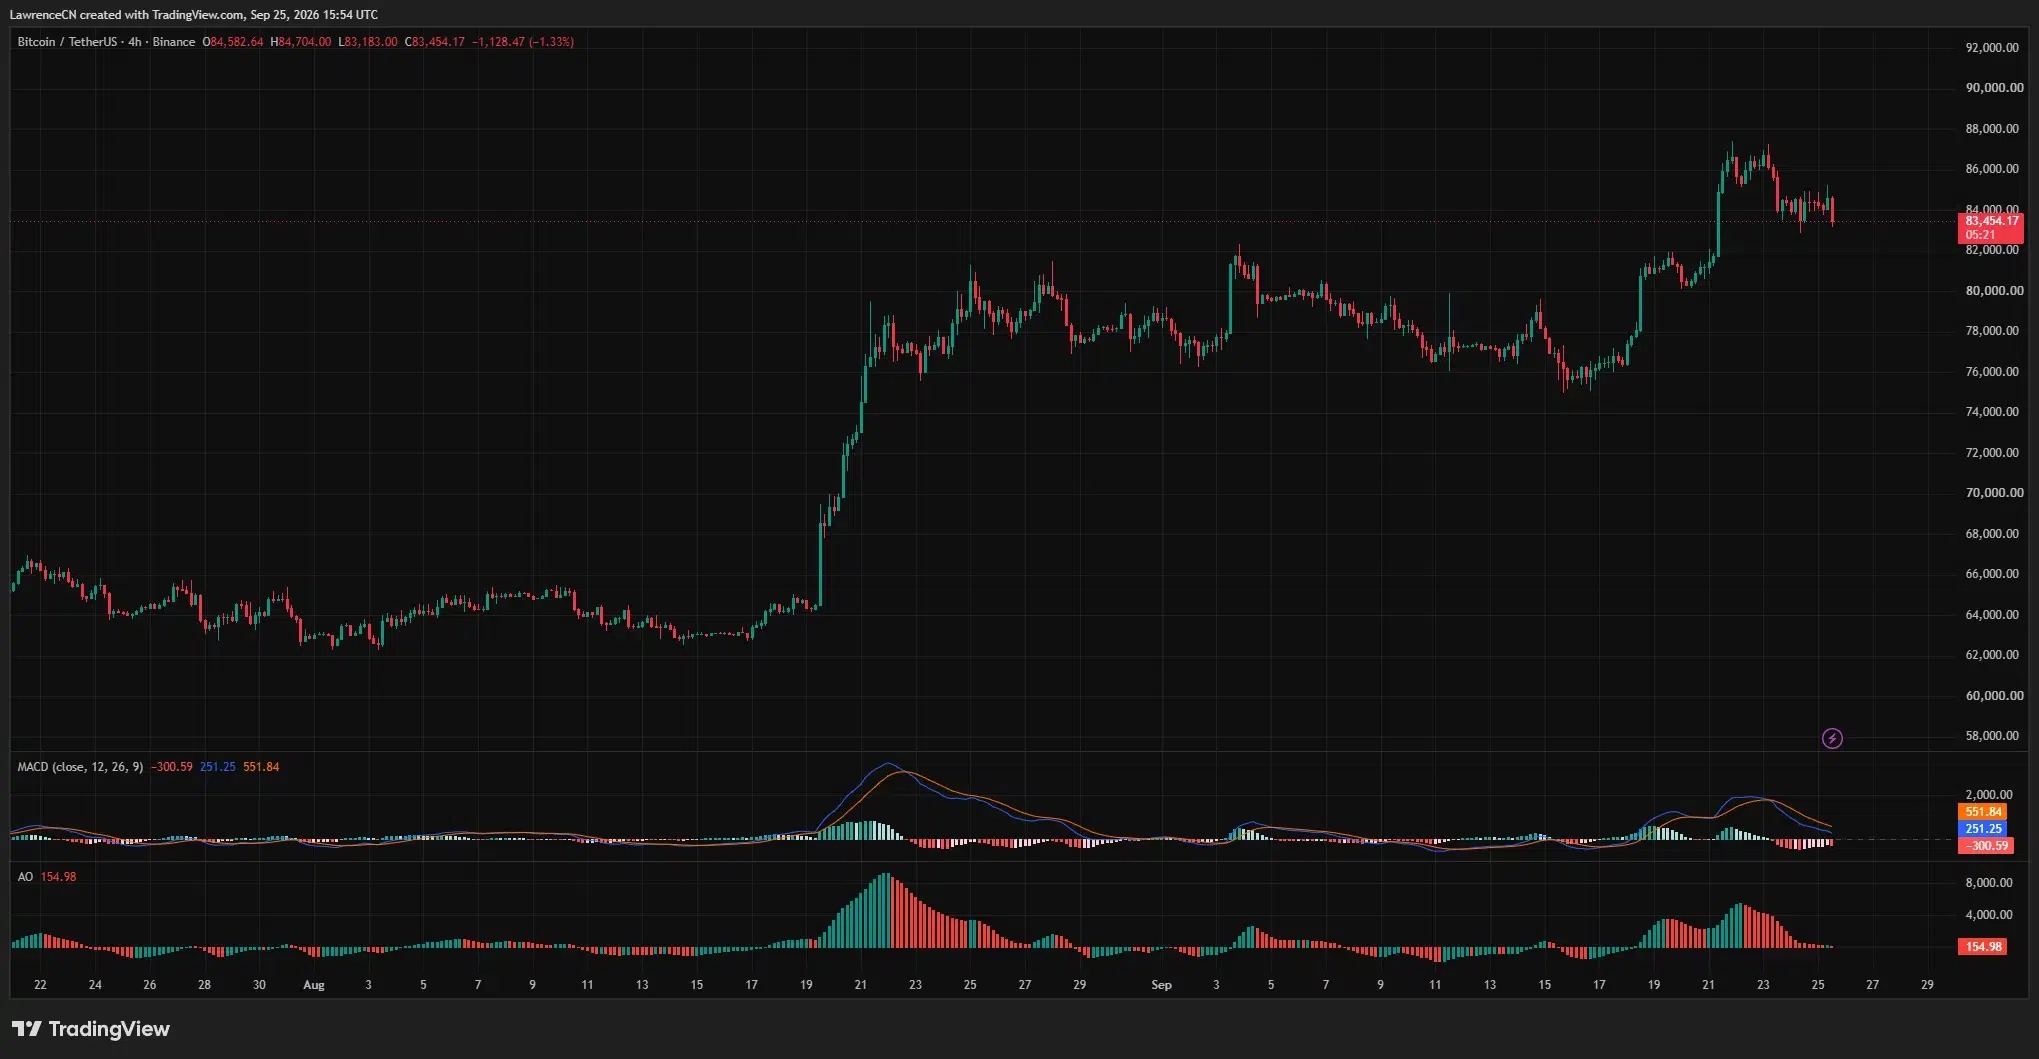
On a 4-hour time frame, MACD has turned negative, indicating that the short-term upward trend is weakening. Meanwhile, Awesome Oscillator is still within the positive range, but the candlestick volume continues to narrow, suggesting that the upward momentum is cooling down.
Traders regard $83,000 as support in the current range, which is also close to a previous local high. If this area is lost, the market may retest the $81,000 region; if prices manage to rise back above $85,200 and stabilize there, they could once again challenge the high levels around $87,000.
Another trader identified the main range of fluctuations in the past two days as between $83,500 and $85,000, indicating that the market is still in a stage of determining its direction.
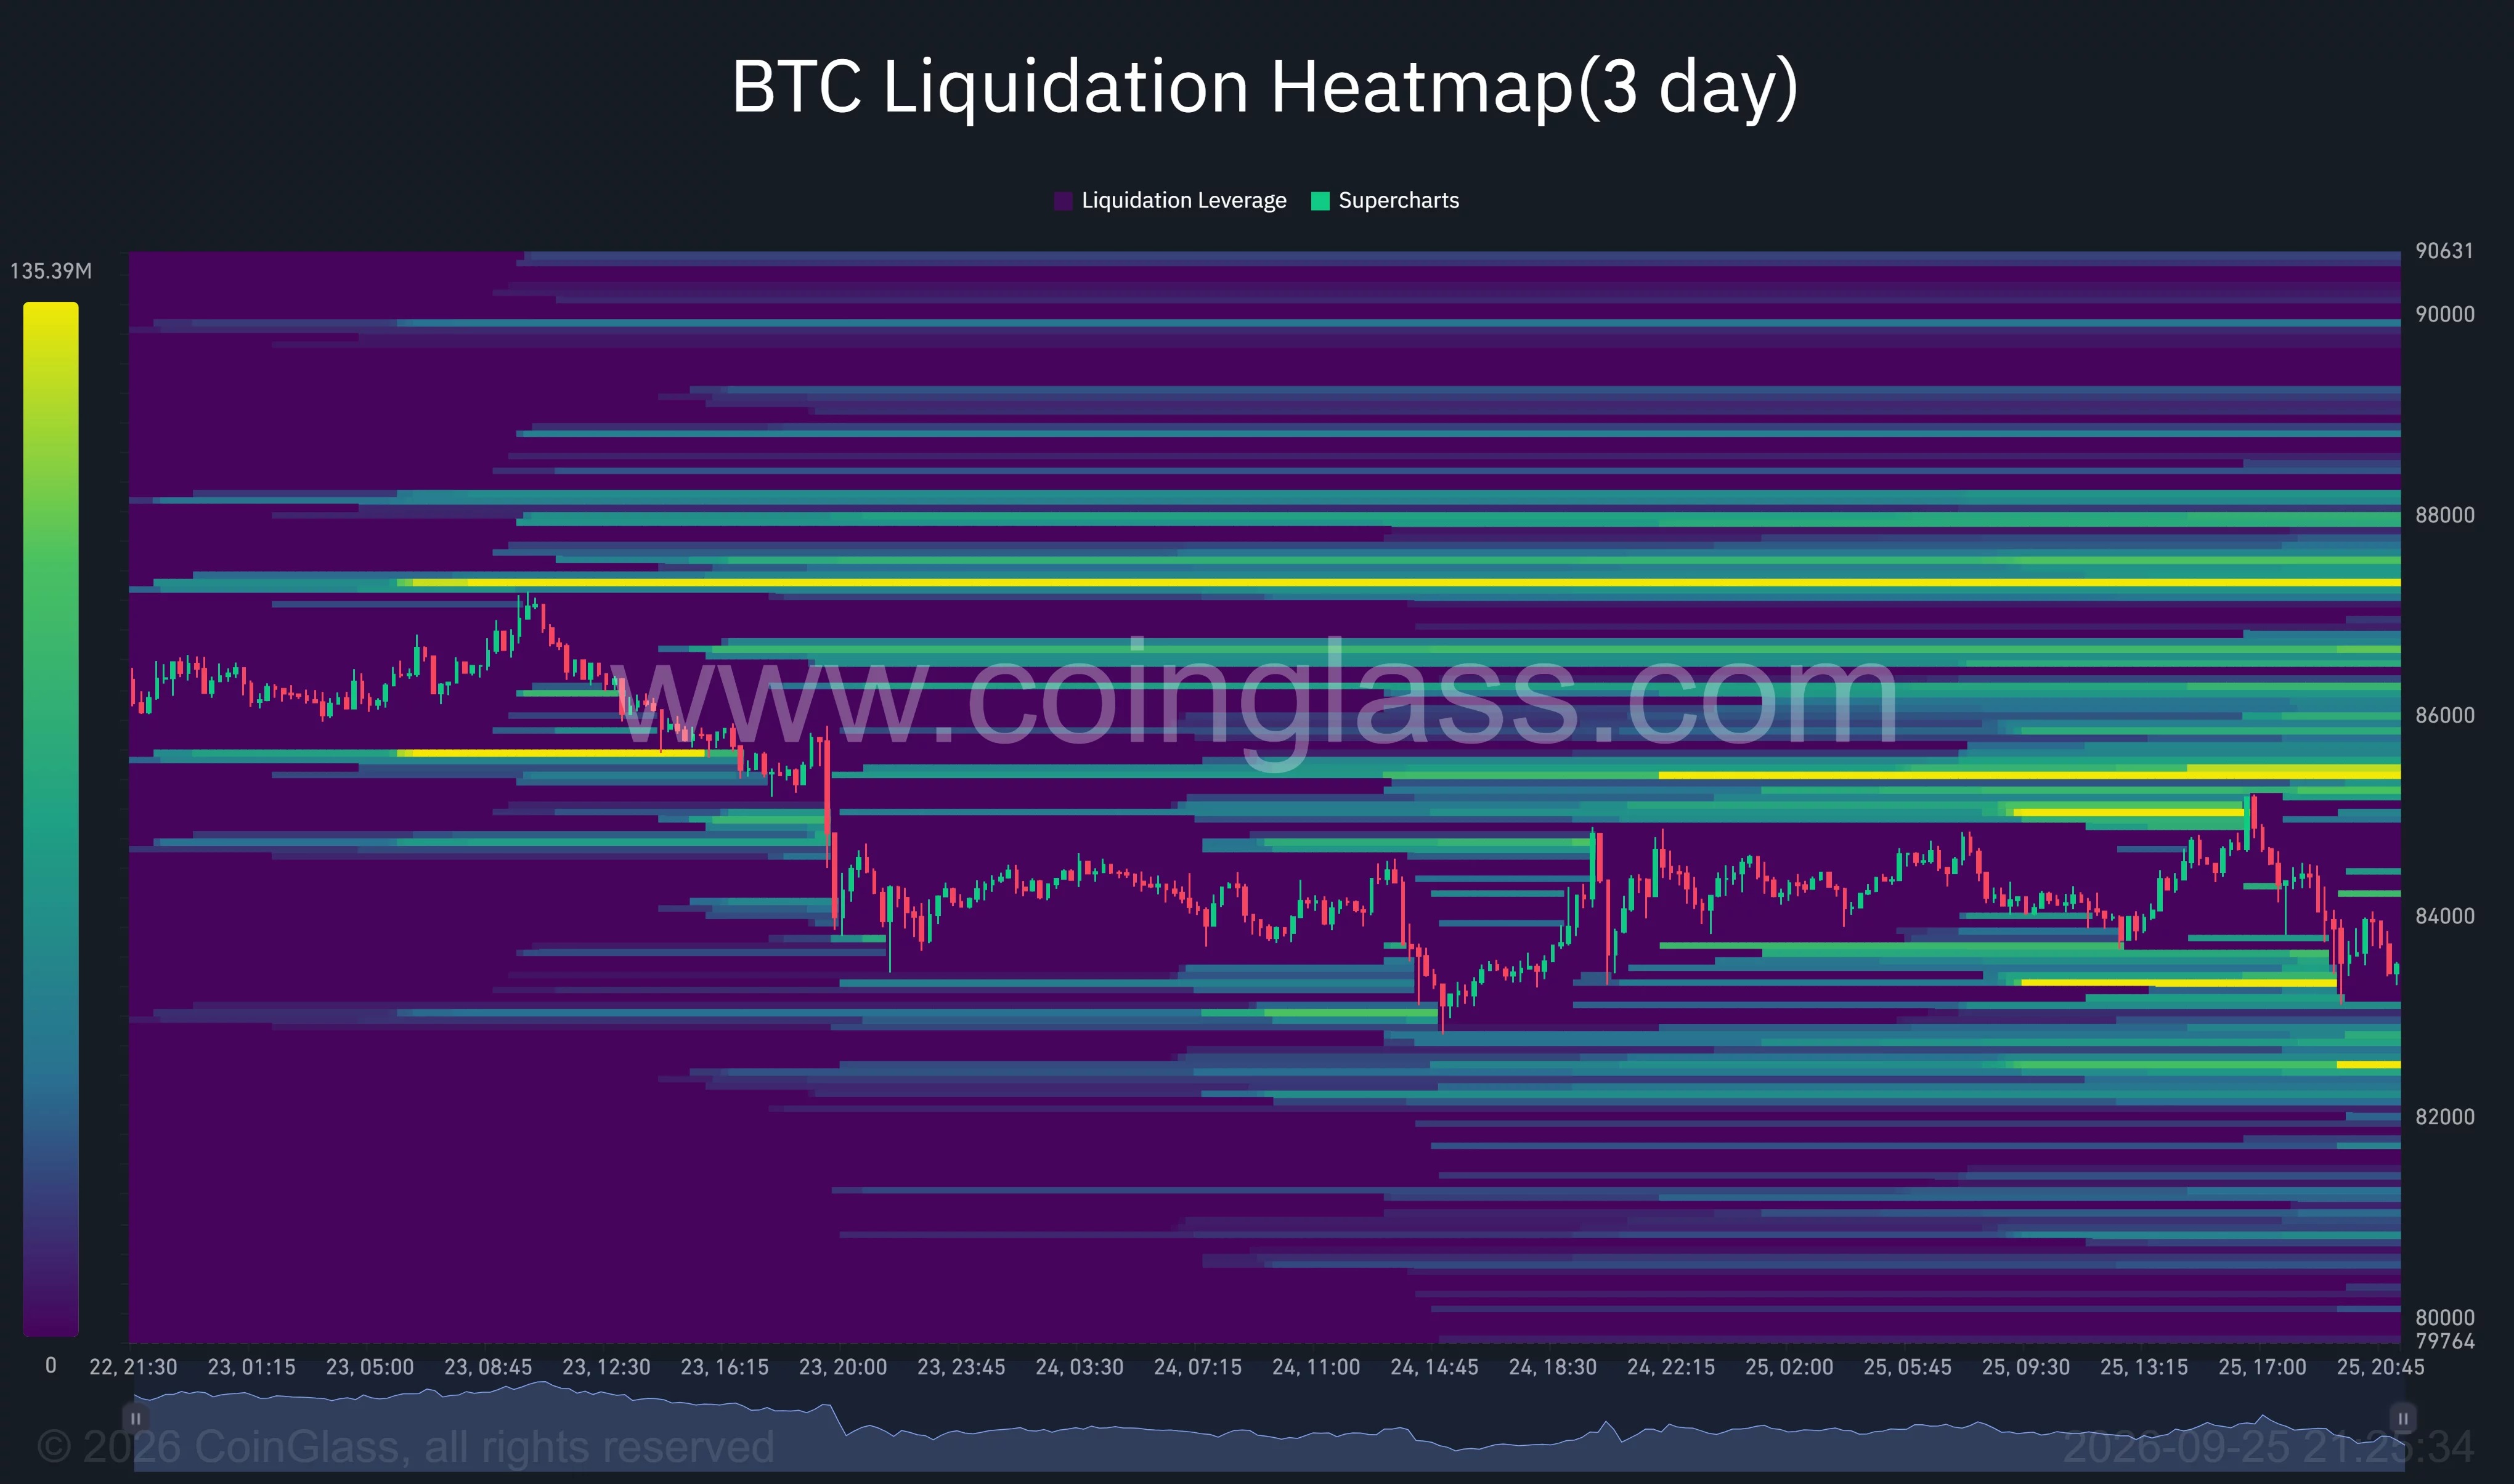
The liquidation-intensive areas are concentrated around $83,300 and $85,200.
The three-day settlement heat map for CoinGlass shows a clear concentration of settlements around $83,300, and there is also a certain level of liquidity distribution near $82,500. Above that, there are concentrated settlement areas around $85,200 to $85,500, as well as near $87,300.
These areas usually indicate that leveraged positions are more concentrated, and once the price touches these levels, it may amplify the range of fluctuations. However, such heat maps can only reflect the potential distribution of liquidations and cannot determine the next direction of the price on their own.
U.S. Treasury yield and ETF cash flow become external variables
In addition to technical factors, the U.S. Treasury market is also affecting the performance of crypto assets. LVRG Research Chief Analyst Dan Khus stated that after a slight easing in the selling of U.S. Treasuries, Bitcoin and Ethereum managed to hold their support levels for the time being. According to him, the yield on 10-year U.S. Treasuries once rose rapidly before falling back to around 5.19%.
He believes that in the coming period, the market will continue to observe whether yields can remain high, whether the expectation of a rate hike in October will continue, and whether the cash flow of ETF can absorb the impact of option expirations around the weekend. At the same time, changes in oil prices and the progress of the US-Iran conflict may also indirectly affect the performance of risky assets through inflation expectations.
The subscription and redemption data for spot Bitcoin in the United States, ETF, is also considered an important indicator of the strength of the buying sentiment. If funds continue to flow into ETF, and Bitcoin manages to hold within the range of $83,000 to $83,500, there may still be room for further gains in the market; if it falls below this range, the levels around $82,500 and $81,000 will become the next areas of focus.