Vanguard High dividend yield ETF On September 25th, it closed at $157.68, up 0.48%. However, behind this small increase, the daily chart shows that VYM is still below the key moving averages, while shorter-term charts suggest that prices are stabilizing – creating a situation of divergence in technical signals.
Key Points
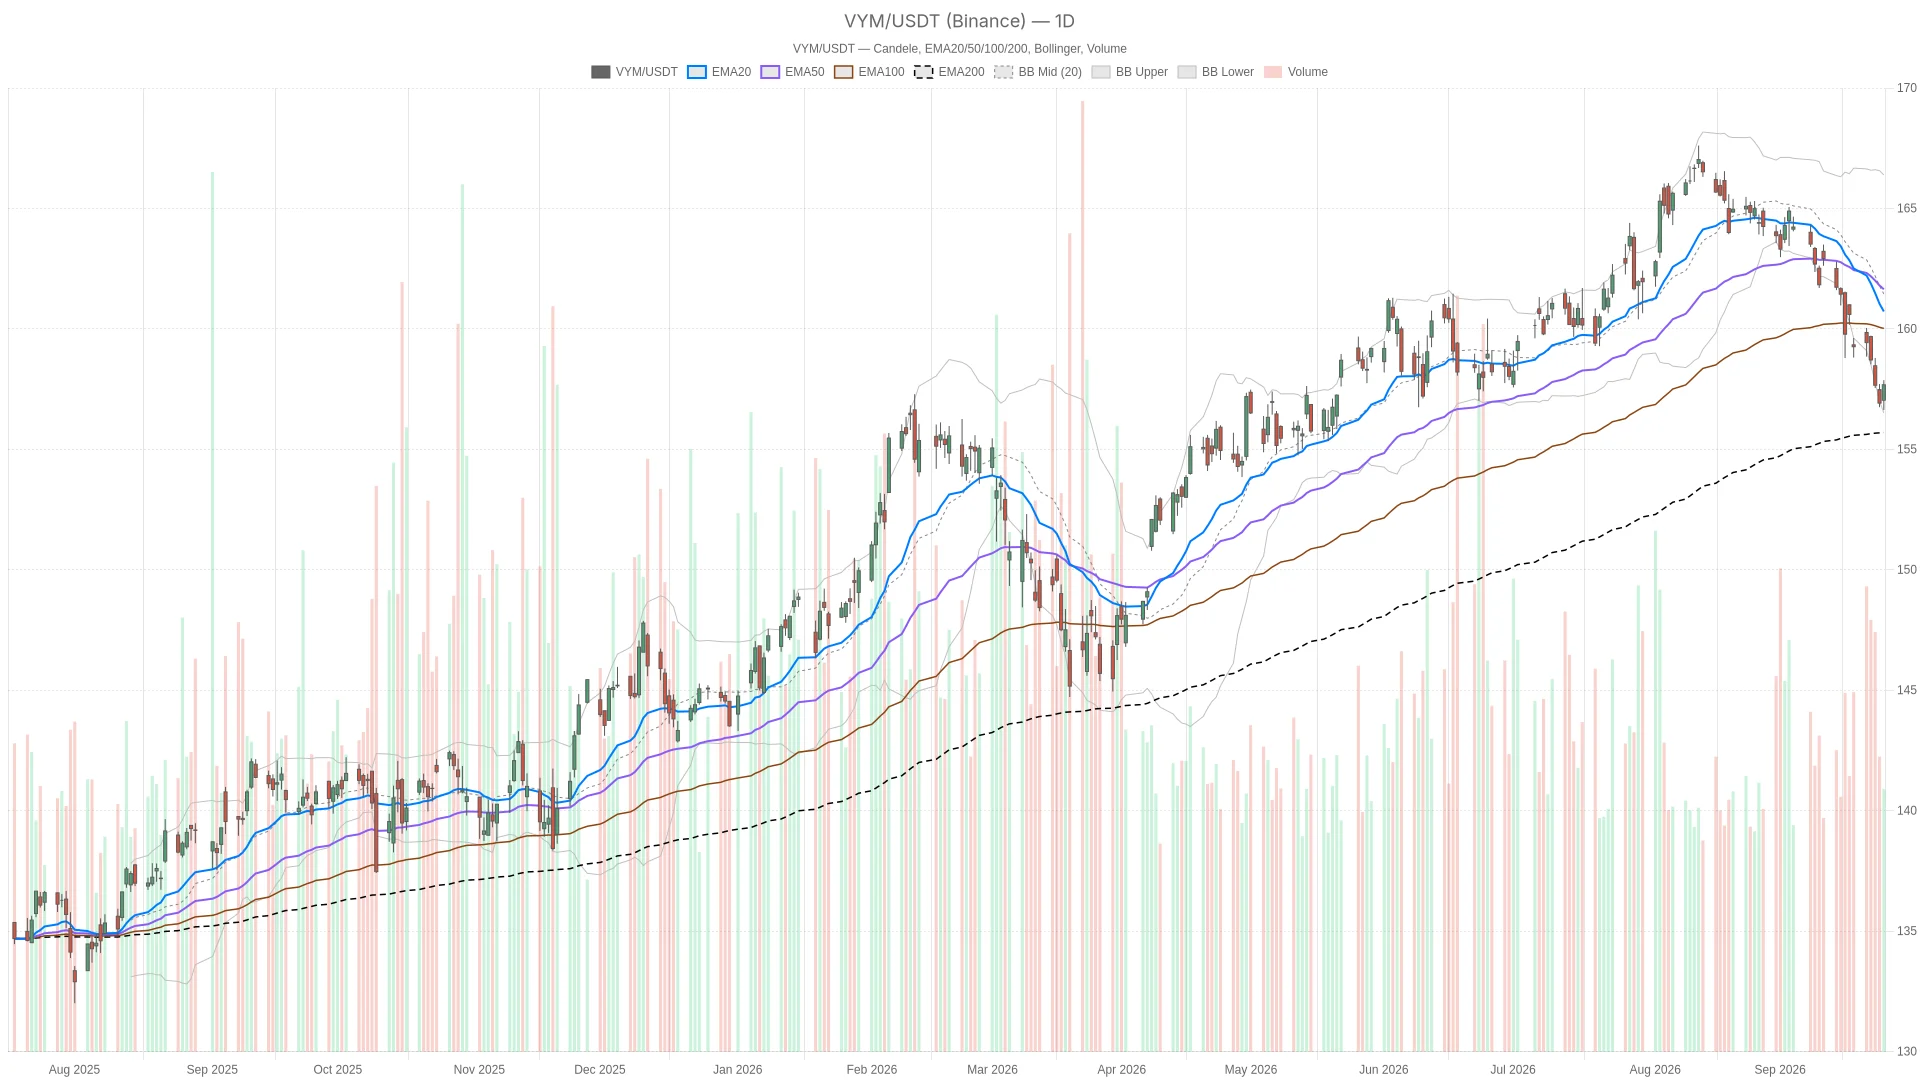
- VYM is priced at $157.68, which is lower than the $160.72 on the 20-day EMA and the $161.64 on the 50-day EMA, but still higher than the $155.70 on the 200-day EMA.
- The daily line RSI14 is at 31.77, which is in an oversold range, while MACD is still negative, at -1.64.
- The 1-hour chart shows early signs of stabilization, with the MACD bar chart slightly turning positive to 0.14.
- The key support level is at $156.92 (daily line S1), and the immediate resistance level is at $158.16 (daily line R1).
- The ATR readings across various time frames show fluctuations at a moderate level, which do not indicate panic selling.
Daily line structure – VYM Testing oversold area
The daily chart of VYM confirms that the fund is in a correction phase, with trading prices below both the short-term and medium-term moving averages. However, the 200-day EMA is at $155.70, which technically maintains the long-term upward trend intact.
Trend and momentum indicators send cautious signals

VYM is trading at $157.68, which is still below the $160.72 on the 20-day EMA and the $161.64 on the 50-day EMA. This indicates that the short-term and medium-term trend structures have weakened. Nevertheless, the price is still above the $155.70 on the 200-day EMA, which means that even if the short-term trend deteriorates, the long-term upward trend remains intact technically.
The daily chart RSI14 is at 31.77, which clearly indicates that it is in an oversold area. This usually means that the selling pressure has been excessively stretched. This does not guarantee that prices will immediately rebound, but it suggests that the room for further selling pressure from sellers is narrowing, and buyers may begin to counterattack.
Banding and pivot points define the range
MACD has also confirmed a bearish tone at present. The MACD line is at -1.64, which is lower than the signal line's -1.11, and the bar chart shows -0.53. Momentum is negative, and although the bar chart has narrowed, it has not yet turned positive. In other words, the daily trend remains bearish, but the rate of decline may be slowing down.
The pivot point further illustrates the tightness of the current range. The daily pivot point is at $157.39, with resistance at R1 at $158.16 and support at S1 at $156.92. The closing price surpassing the pivot point and approaching R1 indicates a small, tactical positive signal within the overall weak daily structure.
1-hour period – stabilization, but a reversal has not yet been confirmed.
The 1-hour chart shows that VYM is stabilizing rather than reversing, with the price hovering around EMA20. The momentum indicators have also shown only initial improvement.
Moving to the 1-hour chart, the situation appears more balanced. The closing price was $157.71, which is basically in line with the $157.65 of the 1-hour EMA20. Meanwhile, EMA50 is at a higher level of $158.66, while EMA200 is even further at $161.66. This arrangement indicates that short-term prices are close to the immediate moving average, but there are layers of resistance above that.
The 1-hour Bollinger Bands indicate that the price is close to the middle band of $157.46, firmly within the range of $156.63 to $158.29. The ATR14 value is $0.42, with moderate volatility. The pivot point shown is $157.68, which is almost exactly consistent with the closing price. Resistance is at $157.90, while support is at $157.49. In short, the 1-hour chart shows that the price is consolidating around its own pivot point, suggesting more of a market pause rather than a clear reversal.
15-minute Perspective – Short-term Execution Background
The 15-minute chart shows stronger short-term momentum, with RSI above 60. However, this should be strictly understood as the execution background, rather than a trend signal.
On the 15-minute chart, the momentum is clearly stronger. RSI14 is at 61.29, the bar chart of MACD has slightly turned positive to 0.02, and the line of MACD is at 0.10, which is higher than the signal line of 0.08. The price of $157.71 is higher than that of EMA20 and EMA50 on the 15-minute chart, which are both at $157.48. However, it is still lower than $158.72 of EMA200.
This strong performance during the session should be regarded merely as part of the execution context. The 15-minute pivot point is at $157.74, with resistance at $157.84 and support at $157.62. This extremely narrow range indicates that prices are consolidating around below the pivot point, without any decisive breakthroughs occurring.
Consistency and Disagreements across Time Frames
Looking at multiple time frames, VYM does indeed show conflicts: the daily chart remains defensive, while shorter time periods suggest a tactical rebound within a larger correction.
When looking at the three time frames together, there is a divergence that needs to be clearly pointed out. The daily chart still shows that the fund is below the short-term and medium-term levels EMA and MACD; the momentum is negative, and RSI is in an oversold area. This indicates a corrective, defensive structure. In contrast, the 1-hour chart shows initial stabilization, with the MACD bar chart turning slightly positive. The 15-minute chart demonstrates clear short-term strength, with RSI above 60.
Therefore, a more honest interpretation is that the dominant daily trend of VYM remains cautiously bearish; at the same time, shorter-term patterns are indicating a tactical rebound within this larger correction. This is a case where signals are indeed divergent, not consistent. Traders should regard intraday strength as a potential mitigating rebound, rather than confirmation of a trend reversal.
Bullish and bearish scenarios
VYM The future path depends on whether the oversold daily conditions can lead to a reversal above $158.16, or whether the bearish trend will regain dominance below $156.92.
For a bullish scenario to materialize, it is necessary for the daily chart RSI to truly reverse from being oversold. If the price can hold the daily support at $156.92 and the 200-day EMA level around $155.70, then re-establish itself above the daily pivot point of $157.39 and further break through the $158.16 level of the R1, there is potential for the price to open up space towards the 20-day EMA of $160.72. If the daily MACD bar chart begins to narrow towards the zero axis, the credibility of this scenario will increase. It would also be beneficial if the 1-hour chart continues to hold its own pivot point at $157.68.
On the other hand, a bearish scenario still completely exists. If the daily support level of $156.92 S1 is broken, it will expose the lower Bollinger Band at $156.51. Given that the daily momentum MACD remains negative, further declines are not surprising. If the 1-hour chart loses the pivot point of $157.68 and falls back below $157.65, which is the EMA20 level, then the narrative of a "preliminary stabilization" would be negated. This would also align shorter-term trends with the weaker daily trend. In such a case, oversold conditions on the daily chart RSI would merely reflect that the market may remain in an oversold state for longer than expected, rather than indicating an impending rebound.
Background from the high-dividend ETF sector
Recent reports have highlighted some structural factors that holders of VYM need to pay attention to, including its index compilation method, as well as its lower fees compared to similar dividends ETF.
In addition to the charts, recent reports have also provided some background information for readers interested in Vanguard high dividend yields. A comparative article by The Motley Fool highlighted the low fee rate of VYM at just 0.04%, as well as its portfolio, which includes 589 stocks, suggesting that this gives it greater diversification compared to Schwab's SCHD, whose yield was mentioned to be 3.1%. Furthermore, an article by Yahoo Finance raised concerns about the index compilation method of VYM, pointing out that its stock selection based on expected dividend yields led it to hold these stocks even before Intel and Walgreen cut their dividends. The article described this as a structural feature of the underlying index's stock selection method, rather than a one-time event. Meanwhile, an international fund related to Vanguard VYMI was mentioned in another Seeking Alpha article as having received a "buy" rating, due to catalytic factors in the finance, energy, and healthcare sectors. This reminds readers that the entire family of high dividend yield funds is being examined from multiple perspectives.
Conclusion
VYM is in a technically interesting position: the weakness on the daily chart contrasts with the strength during the session, indicating a divergence signal. Investors are advised to remain patient and not to draw hasty conclusions on either side too early.
Overall, Vanguard with its high dividend yield ETF is at a technical node that holds considerable interest. The daily trend remains weak, with prices below key moving averages, and MACD is still negative. However, RSI approaching 32 indicates that selling pressure has been stretched to some extent. At the same time, the 1-hour and 15-minute charts show initial stabilization and short-term buying interest, but no confirmed reversal has yet formed on higher time frames. Measured across the three time frames, ATR indicates that volatility is still moderate, not extreme. This suggests that the market is not in a state of panic but is undergoing a normal correction. Given the divergence between the weak daily trend and the strength during trading hours, it is more appropriate to remain patient rather than forming strong judgments about any direction too early. In the coming trading sessions, the daily pivot and support levels around $157.39 to $156.92 may still be key areas of contention.
Frequently Asked Questions
VYM is it currently in a oversold state?
Yes. The daily line RSI14 is at 31.77, which is clearly in an oversold range. This indicates that the selling pressure has been excessively stretched, but it does not guarantee an immediate rebound.
Where is the key support level for VYM?
The most direct support level is the daily S1 pivot of $156.92, followed by the lower Bollinger Band at $156.51 and the 200-day EMA at $155.70. If these levels are broken through, it could open up further downward space.
Does strong performance in the market mean that VYM is about to reverse?
Not yet. Although the 1-hour and 15-minute charts show initial stabilization and stronger momentum, the daily trend remains bearish, with MACD still negative. Strong performances during the session should be seen as a potential mitigating rebound, rather than confirmation of a trend reversal.
What is the fee rate for VYM?
The fee rate for VYM is very low, at only 0.04%. A recent report on The Motley Fool mentioned this point, and also pointed out that its portfolio includes 589 stocks, indicating a high degree of diversification.
Disclaimer:This article is for informational purposes only and does not constitute financial advice or investment guidance, nor does it represent an offer or solicitation to buy or sell any financial instruments or cryptocurrencies. The analysis provided in this text does not guarantee future results. Investing in crypto assets and financial markets carries a high risk of capital loss. Before making any decisions, please conduct your own research ( DYOR ) and consult with a qualified financial advisor.
This article was generated with the assistance of artificial intelligence and has been reviewed by an editorial team.