Microsoft's stock price closed at $516.17 on Thursday, up 3.7%, approaching a historical high. According to Motley Fool, since the low point in June, this round of gains has accumulated a 46% increase. However, further observation suggests that this trend may have become overheated in the short term.
Key Points
- MSFT is trading at $516.17, up 3.7%, and is currently about 6% away from its record high.
- The daily chart EMA remains bullish, with the price above all three major moving averages.
- On the daily chart MACD, a slight bearish divergence appears amidst strong upward trends.
- The hourly chart RSI shows a value of 73.25, indicating that the time frame during the session is in a state of overbought conditions.
- The closing price touched the upper band of the daily Bollinger Bands, indicating that the short-term upward trend is expanding.
Daily chart structure confirms that Microsoft's stock price is still on an upward trend.
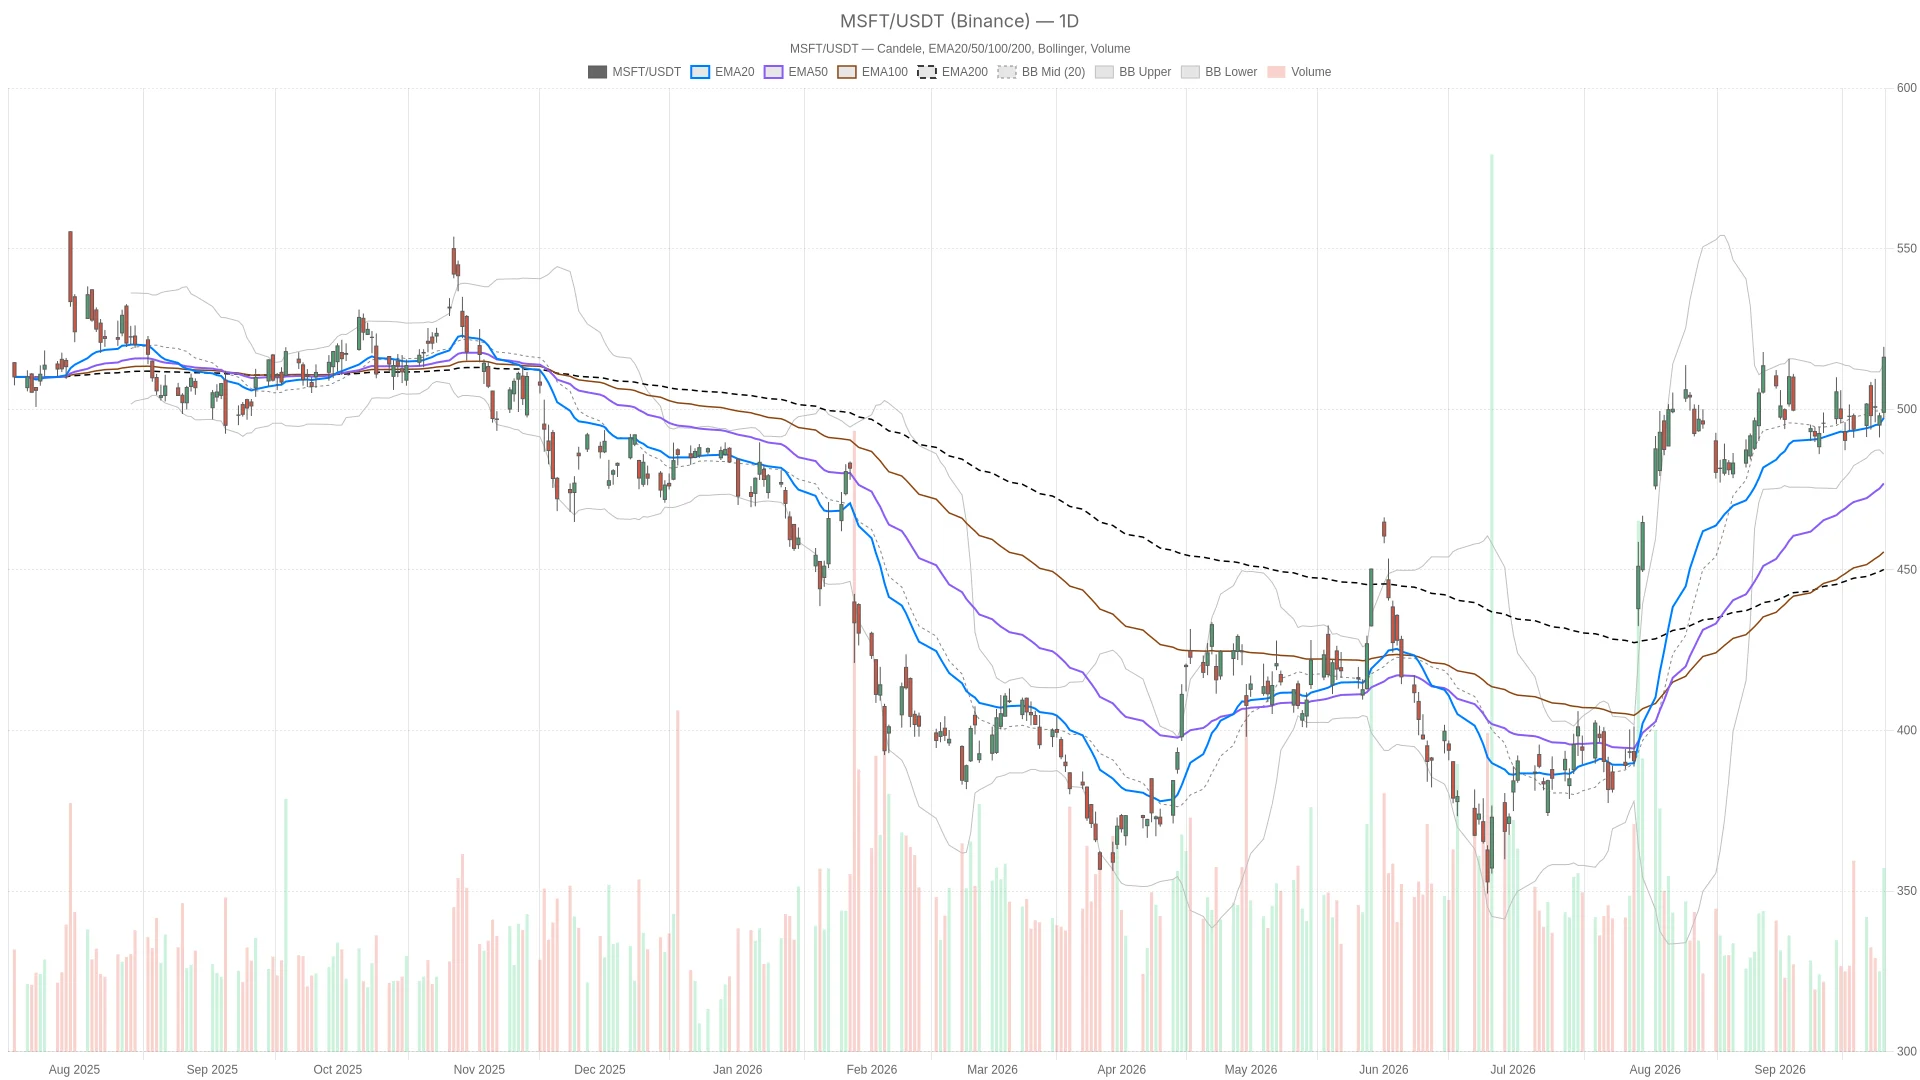
There's little doubt in the daily chart: Microsoft's stock price is still in a clear upward trend. The price is above all the major moving averages, and there is no obvious structural breakdown in this time frame.
EMA Arrange to confirm trend strength

The daily line EMA is clearly arranged. The 20-day EMA is at $497.30, the 50-day EMA is at $476.90, and the 200-day EMA is at $450.09. The price is above these three moving averages, confirming a healthy, upward trend structure, and no technical weaknesses are visible at present.
Momentum indicator issues a mild warning
At the same time, MACD shows a more subtle trend. The MACD line is at 6.78, and the signal line is at 7.55; the bar chart indicates a slight negative value of -0.77. Although the stock price has just recorded a strong daily increase, this momentum indicator is showing signs of cooling down rather than accelerating. This does not undermine the bullish outlook, but it suggests that the driving force behind this round of gains has not strengthened in tandem with the price.
Bollinger Bands add another layer of caution. The daily closing price was above the upper band at $514.04. The middle band is at $500.04, and the lower band is at $486.04. A closing price that breaks through the upper band usually indicates that the short-term trend has extended too far, rather than a disruption in the trend. At the same time, ATR14 is at 10.95, confirming that intraday fluctuations have significantly expanded, which is consistent with the wide range of $497.25 to $519.40 for the day.
The pivot point defines the current trading range. The daily pivot point is at $510.94, with resistance at $524.63 ( R1 ) and support at $502.48 ( S1 ). It is noteworthy that the closing price is significantly higher than the pivot point. This indicates that the short-term trend is still bullish, unless sellers manage to regain the area around $510.
Hourly chart momentum confirms the trend, but there's one reminder.
The hourly chart generally echoes the bullish pattern of the daily chart. The price is also above all moving averages within this time frame, which reinforces a broader upward trend rather than contradicting it.
EMA20 is at $506.65, EMA50 is at $501.58, and EMA200 is at $492.14, all showing a bullish trend, and the prices are above these moving averages.
The issue is that at different time frames, some complex signals are beginning to appear. On the daily chart MACD, there is a cooling trend, while on the hourly chart MACD, the momentum is still accelerating. Meanwhile, the hourly chart RSI is overbought, whereas the daily chart RSI still has room for upward movement.
The hourly chart Bollinger Bands show that the price is at $516.10, firmly within the upper band of $521.82 and above the middle band of $504.02. It is worth noting that this indicates there is still some buffer space for the price before the Bollinger Bands themselves become a technical resistance level.
15-minute chart shows a short-term pause
In the shortest time frame, Microsoft's stock price is consolidating rather than continuing to break through. After a strong intraday rise, the price has made a slight pause below its own 15-minute moving average.
The 15-minute MACD bar chart shows a value of -0.81, which is slightly negative and corresponds to a divergence from the daily trend. This indicates that the recent upward momentum has come to a halt. On this time frame, the Bollinger Bands show that the price is at $516.10, close to the middle band of $516.28, and situated between the upper band of $518.79 and the lower band of $513.78. In terms of actual performance, this more closely resembles a tight consolidation range rather than a new breakout. Traders may pay attention to the pivot range of $515.34 to $516.87 in order to find clues for the next direction.
Bullish scenario for Microsoft's stock price
The bullish scenario is based on the continuation of the trend, and the current structure supports this. If the daily close continues to remain above the pivot point of $510.94, that will be the first confirmation signal for buyers to take another strong stance.
Subsequently, if there is a further breakthrough above the Bollinger Band upper band of $514.04 and the resistance level of $524.63, it will confirm that buyers are still firmly in control of the situation.
The catalytic factors supporting this trend are already in place. CNBC attributes the revision of Microsoft Copilot to driving up stock prices. Additionally, according to reports, the company plans to invest over $10 billion in cloud and AI infrastructure in the Gulf region by 2030. This strengthens the longer-term growth narrative. The 8% increase in dividends mentioned in Motley Fool also provides a reason for holding this stock despite short-term fluctuations, offering a bias towards returns.
If the daily chart RSI can continue to rise slowly without reaching extreme overbought levels, the bullish logic will be further strengthened. If the hourly chart MACD bar chart also continues to maintain positive values, the path with the least upward resistance is still upwards.
Bearish scenario
A bearish scenario does not require a reversal of trend. As long as there is a pause sufficient to absorb the current overextension, the short-term outlook will weaken.
If the daily close falls back below the middle band of the Bollinger Bands at $500.04, that would be an early warning signal. The same applies if it breaks below the support level of $502.48. In either case, it indicates that momentum is weakening, rather than just a period of consolidation.
Given that the reading on the hourly chart RSI is 73.25, a short-term pullback to the hourly level EMA20 near $506.65 is not surprising. This alone does not undermine the broader bullish trend. More importantly, if the daily chart MACD bar chart continues to show expanding negative values, and at the same time prices reach lower highs, that would indicate a true loss of momentum, rather than just the digestion of normal gains.
Final Conclusion
Overall, Microsoft's stock price is still in a clear upward trend on the daily time frame. The hourly chart also generally confirms this pattern. Therefore, the prevailing bias remains bullish.
At the same time, the divergence of the daily chart MACD, the excessive extension of the Bollinger Bands at closing, and the overbought condition on the hourly chart RSI all indicate a higher short-term risk. Taking positions here means having to acknowledge both realities: the trend has not yet been broken, but volatility has increased.
It is normal to see a cooling down in the short term, and it is not something to worry about. Considering that the stock price has risen rapidly this week, this context is very important. As the price of MSFT hovers around 6% below its historical high, the next few trading days will be crucial. Traders will be watching to see if there is further room for growth in this upward trend, or if the gains need to be digested first.
Frequently Asked Questions
Is Microsoft's stock price still in a bull market trend?
Yes. The daily chart shows that the price is above the 20-day, 50-day, and 200-day EMA. The daily RSI14 is at 63.22, which is still in a bullish area, but has not yet entered overbought territory. The broader trend structure remains intact.
Where is the key resistance level for MSFT?
The recent resistance levels are at the daily pivot point of $510.94, followed by the upper Bollinger Band at $514.04 and the R1 resistance at $524.63. The historical high remains the ultimate upward target.
What risks could interrupt the rise in Microsoft's stock price?
The main short-term risk is overextension. The hourly chart RSI shows a level of 73.25, indicating overbought conditions, while the daily chart MACD bar chart indicates cooling trends despite rising prices. If the closing price falls below the middle band of the Bollinger Bands at $500.04, it would be an early warning signal.
What fundamental catalysts support the stock price of MSFT?
Microsoft's plans for renovation, aiming to invest over $10 billion in cloud and AI infrastructure in the Gulf region by 2030, as well as an 8% increase in dividends, all support the narrative of long-term growth and earnings.
DisclaimerThis article is for informational purposes only and does not constitute financial advice, investment advice, or an offer to buy or sell any financial instruments or cryptocurrencies. The analysis contained in this text does not represent future results. Investing in crypto assets and financial markets carries a high risk of capital loss. Before making any decisions, please conduct your own research ( DYOR ) and consult a qualified financial advisor.
This article was generated with the assistance of artificial intelligence and has been reviewed by an editorial team.