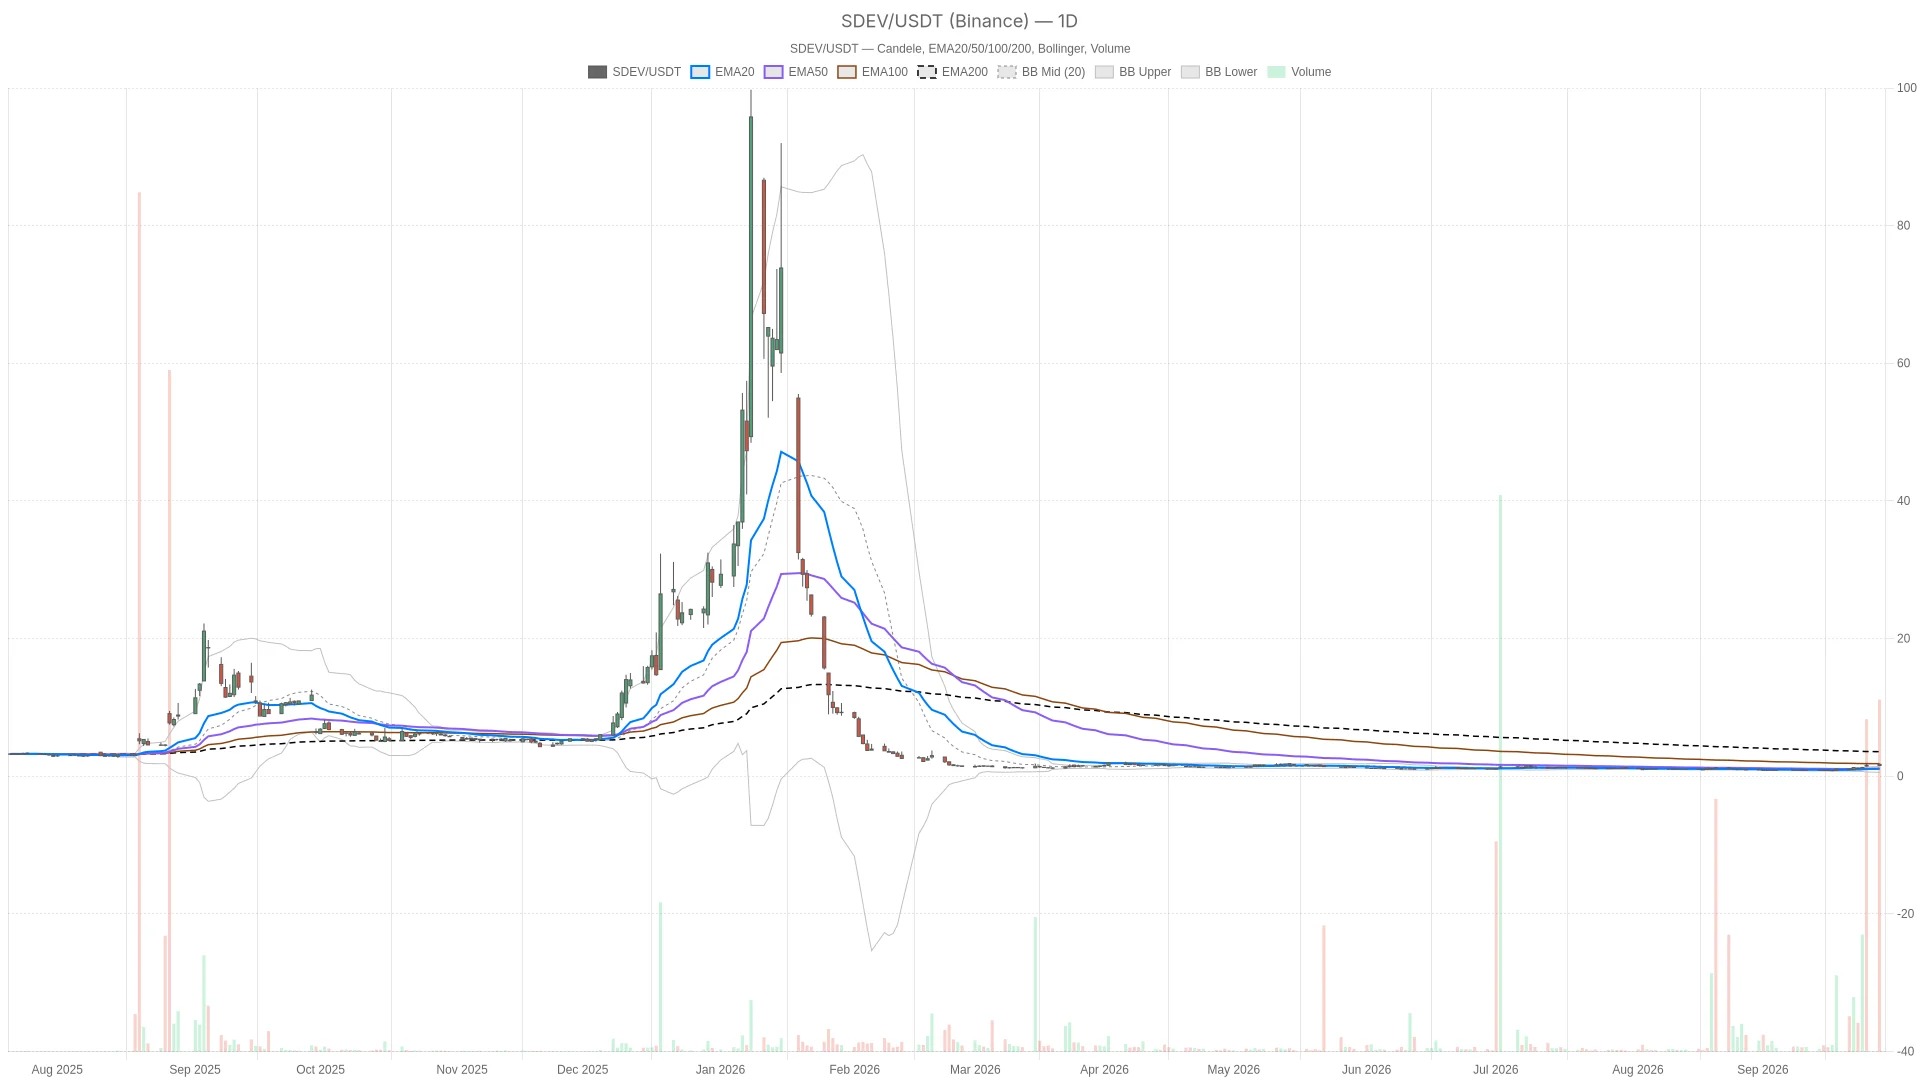
SDEV closed at $1.57 on Monday, up 5.37%, but the daily chart of Stablecoin Development Corporation shows a more complex situation. The stock price once soared to $1.79, then tumbled sharply. As intraday momentum weakened and trading volume increased, the stock price was in an overbought state.
Abstract
Key Points

- On the 14th, RSI was at 73.22, clearly in an overbought zone, with the closing price above the upper band of the Bollinger Bands at 1.44 USD.
- There are still a relatively large number of EMA entries at the hourly level, but the bar chart for MACD has narrowed to 0.01, indicating that the momentum is slowing down.
- Key levels: Daily pivot point at $1.61, support level at $1.43, resistance level at $1.75; if it falls below $1.43, the bullish outlook for the short term will become invalid.
- On the 200th day, EMA was at $4.19, which is significantly higher than the current price, confirming that the stock is still in a long-term downward trend.
Daily chart: Why does the stock Stablecoin Development Corporation seem to be overbought?
The daily chart of Stablecoin Development Corporation stock shows a clear overbought condition. On the 14th, it was at RSI, firmly above the overbought threshold of 70. At the same time, the closing price of $1.57 was also higher than the upper band of the Bollinger Bands, which is $1.44.
The day's trend itself also sent out cautious signals. The stock price opened at $1.74, peaked at $1.79 during the session, and then fell to a low of $1.47. Calculated from closing price to closing price, it rose by 5.37% from the previous day's $1.49. However, calculated from opening to closing, the stock actually fell by 9.77% for the day. The relatively high trading volume also confirms that this reversal was not an accidental fluctuation caused by low liquidity.
The trend landscape shows differentiation across two time dimensions. The 20-day and 50-day EMA levels are around $1.10 to $1.11, both significantly lower than the closing prices. This reflects the rapid rebound of SDEV in recent weeks. However, the 200-day EMA level is still as high as $4.19. This gap is significant, indicating that the stock is still working its way up from a deep, long-term downward trend. The current rebound has not yet repaired the more widespread technical damage.
Kinetic energy and volatility signals
The MACD line is at 0.10, still higher than the signal line of 0.02, and the bar chart shows a positive value of 0.08. Technically, there is still a bias towards trend-following signals. At the same time, an overbought RSI condition combined with a breakout above the Bollinger Bands often indicates either a continued strong upward trend or a rapid return to average. On Monday, the price fell from $1.79 to $1.57, suggesting that the latter scenario is more likely to occur.
Volatility is high. The daily ATR level is 0.17, which is a significant amount considering the stock price of $1.57, indicating a wide range of intraday fluctuations. The pivot point also reinforces the narrative of a failed breakout. The daily pivot point is at $1.61, the resistance level is at $1.75, and the support level is at $1.43. On Monday, the price reached a high of $1.79 and briefly broke through the resistance, but then it fell back below the pivot point. This pattern suggests that when the upward trend is too fast and too strong, selling pressure begins to emerge.
It is worth noting that the system classifies the daily line as neutral, rather than bullish. This classification is reasonable, as the relevant evidence is contradictory. Momentum indicators point to higher levels, but the distance from the 200-day EMA and the reversal during the session suggest caution should be exercised. In short, the daily time frame provides more of a warning than a clear directional signal. The speed of this rebound has already exceeded what the underlying trend structure can support.
Hourly chart: Should we still be bullish on the short-term trend?
The hourly chart depicts SDEV more positively, but conditions still need to be maintained. The 20-hour, 50-hour, and 200-hour EMA lines are arranged in a typical bullish sequence, at 1.46 USD, 1.27 USD, and 1.07 USD respectively. Since the price is above these three moving averages, the system marks the 1-hour time frame as bullish.
In 1 hour, RSI is at 64.57, which supports a bullish perspective, but it has not yet reached overbought levels. There is still some room before the hourly momentum becomes excessively stretched. However, the MACD bar chart has narrowed to just 0.01. The MACD line at 0.12 is only slightly higher than the signal line at 0.11. Although the trend structure remains intact, this narrowing of the gap indicates that the rate of increase is slowing down.
The price is located near the middle of the hourly Bollinger Bands, within the range of $1.45 to $1.71. It is slightly below the hourly pivot point of $1.61 and lies between the support level of $1.52 and the resistance level of $1.68. Overall, the hourly chart confirms an upward trend, but it also subtly indicates that the pace of the rise is weakening.
15-minute chart: The market is in pause mode.
After zooming in to a 15-minute chart, the trend becomes flat. RSI is almost exactly at the neutral level of 49.77. The MACD line coincides with the signal line at 0.04, and the bar chart reading is zero. These readings indicate that there is no clear unilateral momentum at present.
The closing price was $1.58, which is nearly at the 15-minute pivot point of $1.59 and near the middle band of the Bollinger Bands at $1.59 as well. The 20-week EMA is at $1.61, slightly above the current price, while the 50-week EMA is at $1.53, below the current price. This confines the stock price within a narrow range with little direction. For traders using this time frame to look for entry points, the signal is clear: there are no immediate signs of a breakout. It seems that the market is pausing to digest the reversal from the previous trading day.
Overall, these three time frames do not completely coincide. The daily chart shows overbought momentum colliding with failed breakouts, as well as the pressure of a long-term downward trend. The hourly chart confirms that the short-term structure is more bullish, but the momentum is weakening. The 15-minute chart is neutral. Such discrepancies represent the most honest description of the current state of SDEV.
Stablecoin Development Corporation Bullish Scenario for Stocks
To continue the bullish trend, the Stablecoin Development Corporation stock needs to maintain a EMA pattern on the hourly time frame. The price must remain above $1.46. If it can re-establish itself above the daily resistance level of $1.75 and the intraday high of $1.79 with increased trading volume, it will indicate that the buying pressure has absorbed the selling pressure from Monday.
The hourly MACD bar chart has once again risen, which also helps to confirm that the momentum is accelerating rather than weakening further. If the daily RSI line can cool down from 73 without breaking through the support level, then this will form a healthier structure than if it continues to rise immediately. The key to a bullish scenario lies in the price structure remaining intact while the overbought conditions are alleviated over time rather than through a price drop.
Bearish scenario: What could render bullish logic invalid?
On the contrary, if the price falls below the daily pivot point of $1.61 and further closes below the support level of $1.43, then the short-term bullish logic will be invalidated. This would confirm that the reversal on Monday is the beginning of a deeper pullback. On the hourly chart, a breakdown of $1.46 EMA would be an early warning sign.
Given that the price is still far below the 200-day EMA of $4.19, any further weakening would reinforce a sobering reality: this is more likely to be just a rebound within a larger downward trend, rather than a complete reversal of trend. The broader structure remains bearish in the long term.
Industry Background: The Momentum of Stablecoins Other than SDEV
The broader topic of stablecoins has also attracted attention elsewhere, but none of these developments can directly explain the trend of SDEV. Citibank's expanded cooperation with Coinbase regarding stablecoins was disclosed after the close of trading on Monday, so it is impossible to explain that day's market movements. Meanwhile, over the past week, there have been separate reports about SoFi Technologies and Mastercard launching stablecoin settlement plans, which are said to be related to a card-swiping project worth $25 billion.
These messages indicate that sentiment related to stablecoin infrastructure remains active. However, their correlation with the price trend of SDEV is quite weak. This stock seems to be driven more by its own technical aspects than by industry-related news flows. For now, the chart of SDEV tells its own story—a story defined by internal dynamics rather than external catalysts.
Overall, SDEV is currently at a technically vulnerable point. The daily chart shows overbought conditions and a recent failed breakout; the hourly chart indicates more buying pressure but with diminishing momentum, while the 15-minute chart lacks a clear direction. On the daily chart, ATR is at 0.17, with a wide range of trading during the session, and the volatility remains high. This increases the risk of one side taking control of the trend next. Position control and patience around key price levels are more important than confidently predicting the next move.
Frequently Asked Questions
Stablecoin Development Corporation What is the current price of the stock?
SDEV closed at $1.57 on Monday, up 5.37% from the previous closing price of $1.49, but fell 9.77% from its opening price of $1.74 due to a sharp reversal during trading.
SDEV Is the stock in a overbought state?
Yes, on the daily chart for the 14th day, RSI was at 73.22, which is above the overbought threshold of 70. Moreover, the price closed above the upper band of the Bollinger Bands at $1.44, indicating that the conditions are already tight.
What are the key support and resistance levels for SDEV?
The daily pivot point is at $1.61, the support level is at $1.43, and the resistance level is at $1.75. On the hourly chart, $1.46 EMA is a key support level, with the resistance level at $1.68.
Is the long-term trend of SDEV still bearish?
The 200-day EMA of $4.19 is still significantly higher than the current price of $1.57, which confirms that despite a recent short-term rebound, the stock is still in a long-term downward trend.
This article was generated with the assistance of artificial intelligence and has been reviewed by an editorial team.