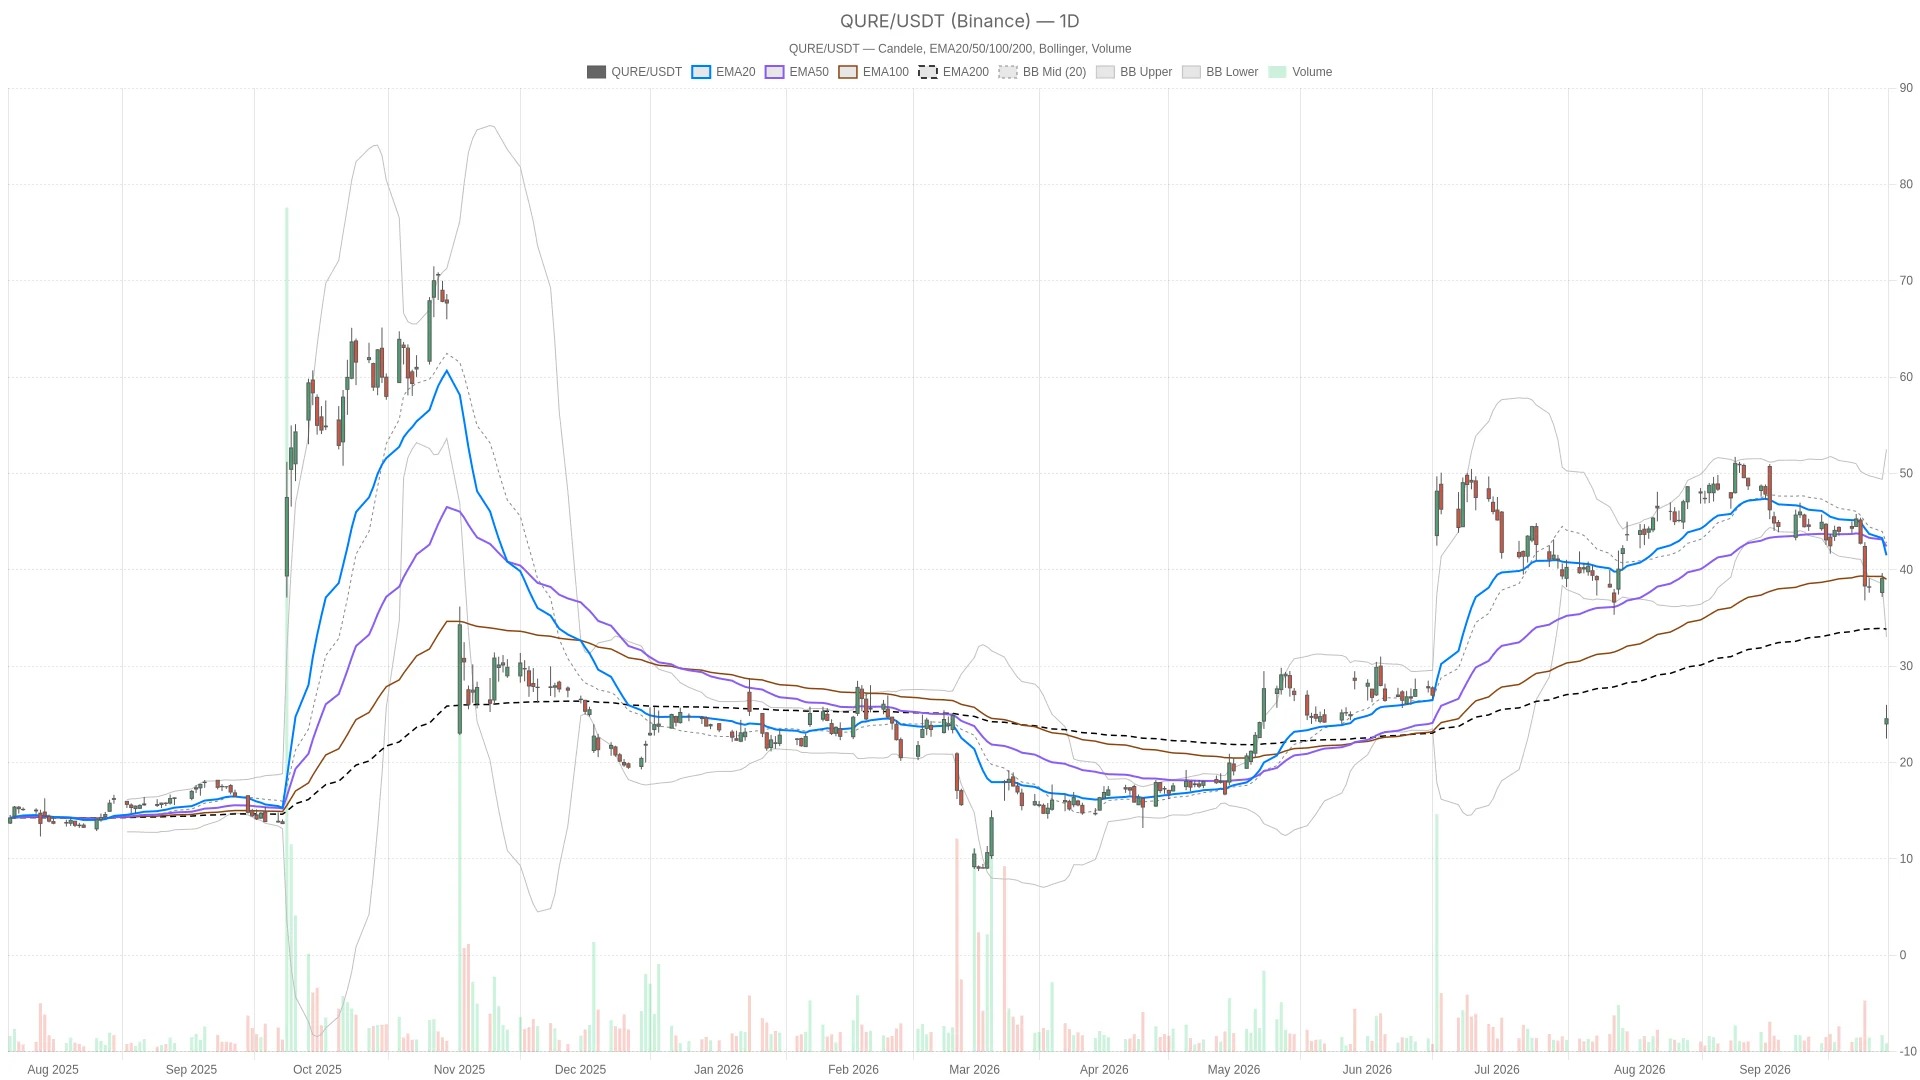
uniQure N.V. On Tuesday, the stock price plummeted by 37.25% to $24.54. After such a sharp one-day revaluation, almost all technical indicators have entered extreme regions. This trend requires the market to re-evaluate the overall direction, momentum, and any possible turning points.
Key Points
- uniQure N.V. On September 29, 2026, the stock price fell by 37.25% to $24.54 in a single day.
- On the daily chart, RSI fell to 17.56, sinking into an oversold zone, which usually only appears during the stage of panic selling.
- The price has fallen below all the major moving averages on the daily, hourly, and 15-minute charts.
- On the daily chart, the MACD bar chart shows a value of -1.65, which continues to widen, indicating that selling pressure is still accelerating.
- The stock price is significantly below the lower band of the daily Bollinger Bands at $33.04, indicating a severe deviation.
uniQure N.V. The daily chart shows a structural break.
The daily chart shows a structural break. The stock clearly gap down and fell below all major moving averages within a single trading day. EMA20 is at 41.5, and EMA50 is at 42.42. Even the long-term EMA200 is at 35.19, which is still significantly higher than the current price of $24.54. This arrangement indicates that the support level that has been maintained for the past few months was broken through within just a few hours.
It is worth noting that the system's status readings still label the daily trend as neutral. This serves as a reminder that, after such a significant shock in market conditions, trend-following indicators will inevitably lag behind. However, judging from the price action itself, the direction is already very clear.
Kinetic energy further confirms the severity of this decline. The daily line RSI14 has fallen to 17.56, deeply in an oversold zone, a reading that usually only appears during the stage of panic selling. Meanwhile, the daily line MACD is at -2.82, with the signal line at -1.18, and the resulting bar chart shows a value of -1.65, which is still expanding. The selling pressure is accelerating rather than weakening.
Volatility Background and Pivot Points

Volatility tells the same story. The middle band of the daily Bollinger Bands is at 42.76, the upper band at 52.49, and the lower band at 33.04. The price of $24.54 is even below the lower band itself. Such a rare deviation usually indicates either that the trend is accelerating downward or that we are in the early stages of a rebound towards the mean. The intraday volatility range has significantly expanded, with ATR14 at 3.28.
The pivot point for this trading session is 24.34. The resistance level is at 26.18, and the support level is at 22.69. This means that the current price is near the pivot point, with limited room to test the upper or lower boundaries.
Hourly chart momentum confirms bearish pressure
The hourly chart momentum further strengthens the bearish outlook. All moving averages are above the price, and RSI is also deeply in an oversold zone. The 1-hour chart reading is clearly bearish. EMA20 is at 33.19, EMA50 is at 37.81, and EMA200 is at 42.96, all of which are stacked above the current price. This is a textbook example of a bearish pattern.
RSI14 is at 22.35, still in a state of deep oversold conditions. MACD is at -4.13, the signal line is at -2.72, and the bar chart shows -1.4, which is still negative. Meanwhile, the lower band of the hourly Bollinger Bands is at 22.56. Prices are approaching this boundary, but they have not yet fallen completely outside the bands as they did on the daily chart.
Therefore, the daily and hourly timeframes are in agreement in direction. The overall structure is bearish, with momentum still leaning downward. The hourly pivot point is at 24.47, the resistance level at 25.02, and the support level at 24.15. Prices are fluctuating within a narrow range above the pivot point. It seems that the market is digesting this decline rather than making a clear choice of direction.
Short-term charts show initial signs of stabilization
The 15-minute chart shows the first sign of stabilization. In an overall bearish trend, MACD is forming a slight bullish crossover. RSI14 has risen back to 32.08, which is still weak, but no longer at extremely low levels. MACD is at -2.46, while the signal line is at -2.94, forming a positive bar with a height of 0.48. This slight bullish crossover usually indicates that short-term selling pressure is nearly exhausted, rather than a complete reversal.
However, from a broader trend perspective, this time frame is still bearish. EMA20 is at 26.19, EMA50 is at 30.64, and EMA200 is at 37.86, all of which are above the current price. The status labels also confirm a bearish environment. The Bollinger Bands here are narrower, with the middle band at 24.23, the upper band at 25.32, and the lower band at 23.14. The price of $24.54 is within the bands, close to the middle band. This is consistent with the intraday pause suggested by the MACD bar chart.
Currently, on the 15-minute chart, the pivot point is at 24.62, the resistance level is at 24.70, and the support level is at 24.46, forming a very narrow trading range.
Bullish scenario: What is needed for a rebound?
For a bullish reversal to occur, the price needs to first retest the hourly pivot resistance of $25.02, and then break through the daily resistance of $26.18. The bullish logic is almost entirely based on mean reversion. Both the daily RSI of $17.56 and the hourly RSI of $22.35 are at extreme levels, so regardless of the underlying trend, a technical rebound is reasonable.
For this scenario to continue, the price needs to stabilize above 26.19 on the 15-minute chart EMA20. This will help confirm that the buying pressure is genuine and not just a short covering move. Until then, any rise should be seen as a rebound within a breakout structure, rather than evidence of a trend reversal.
Bearish scenario: Downside risks remain the focus
Bearish sentiment still dominates the judgment. The MACD bar chart shows negative values on both the daily and hourly timeframes, with prices below all major moving averages. The overall evidence still supports a continuation of the downward trend. The MACD bar charts on both the daily and hourly timeframes also remain negative, with prices below all major moving averages across the three time frames.
In this context, if the daily support level of 22.69 is broken through, the next reference point will be below the current Bollinger Band lower band at 33.04 USD. Compared to the current price of 24.54 USD, this area already appears to be overextended. If the hourly support level of 24.15 is also lost, that would be significant as well. If, at the same time, the MACD bar chart starts to accelerate downward again, it would negate the bullish rebound assumption and indicate further downward pressure.
Position allocation in a high-volatility environment
After losing more than a third of its market value in a single day, the stock prices of uniQure and N.V are at a true turning point. Both the daily and hourly charts indicate a bearish structural trend. In contrast, the 15-minute chart only shows initial, tentative stabilization.
However, oversold momentum readings are present in all time frames, which suggests that there is still room for a rapid rebound driven by sentiment. But such a rebound alone cannot repair the technical structure that has already been damaged. Given that the ATR reading is on the high side and the price has fallen outside of the daily Bollinger Bands, volatility will remain a key characteristic of subsequent trading. As this trading session has not yet ended, any position-taking decisions must take into account the possibility of even more significant two-way price fluctuations.
Frequently Asked Questions
Why did the stock price of uniQure N.V fall by 37% on September 29, 2026?
The article does not identify the specific catalysts for this decline. What is certain is that this was a sharp one-day revaluation that pushed almost all technical indicators into extreme ranges. The stock closed at $39.11 on the previous trading day and was reporting at $24.54 as of 2:18 p.m. Eastern Time on Tuesday.
uniQure N.V. Has the stock price become oversold after a 37% plunge?
Yes, this is the case for all time frames. On the daily chart RSI, it has fallen to 17.56, and on the hourly chart RSI, it is at 22.35, both deeply in oversold territory. However, on the daily chart MACD, the bar chart is still expanding to -1.65, indicating that despite the extreme conditions on RSI, the selling pressure is still accelerating.
uniQure N.V. Where is the key support level for stock prices?
The key support levels are at $22.69 on the daily chart and $24.15 on the hourly chart. Below that, the lower band of the Bollinger Bands on the daily chart, which is at $33.04, has already been broken through, and there are almost no reliable reference supports in the current price range.
This article was generated with the assistance of artificial intelligence and has been reviewed by an editorial team.