Key Points
- The current company news that is circulating does not explain this rise, and there is no direct trigger for this change recorded in the known news.
- The daily line RSI is at 65.38, still below the overbought range; the hourly line RSI is at 78.94, indicating severe short-term overbought conditions.
- Goldman Sachs first covered the stock on September 24, giving a ‘sell’ rating and a target price of $321; Seeking Alpha and Yahoo Finance believe the stock is undervalued.
- The stock price has surpassed the upper band of the daily Bollinger Bands at $522.47, indicating that this is a genuine breakout beyond the normal daily fluctuation range.
The current company news circulating does not explain today's rise. The latest headlines are from two to four days ago, focusing on Goldman Sachs' "sell" rating and the subsequent 4% decline, rather than what happened during today's trading session. Therefore, although this fluctuation is clearly visible across various time frames, its immediate triggering factors are not recorded in the current news. Thus, the following analysis will mainly focus on the technical aspects.
United Therapeutics Stock: The daily chart has been stretched to extreme levels

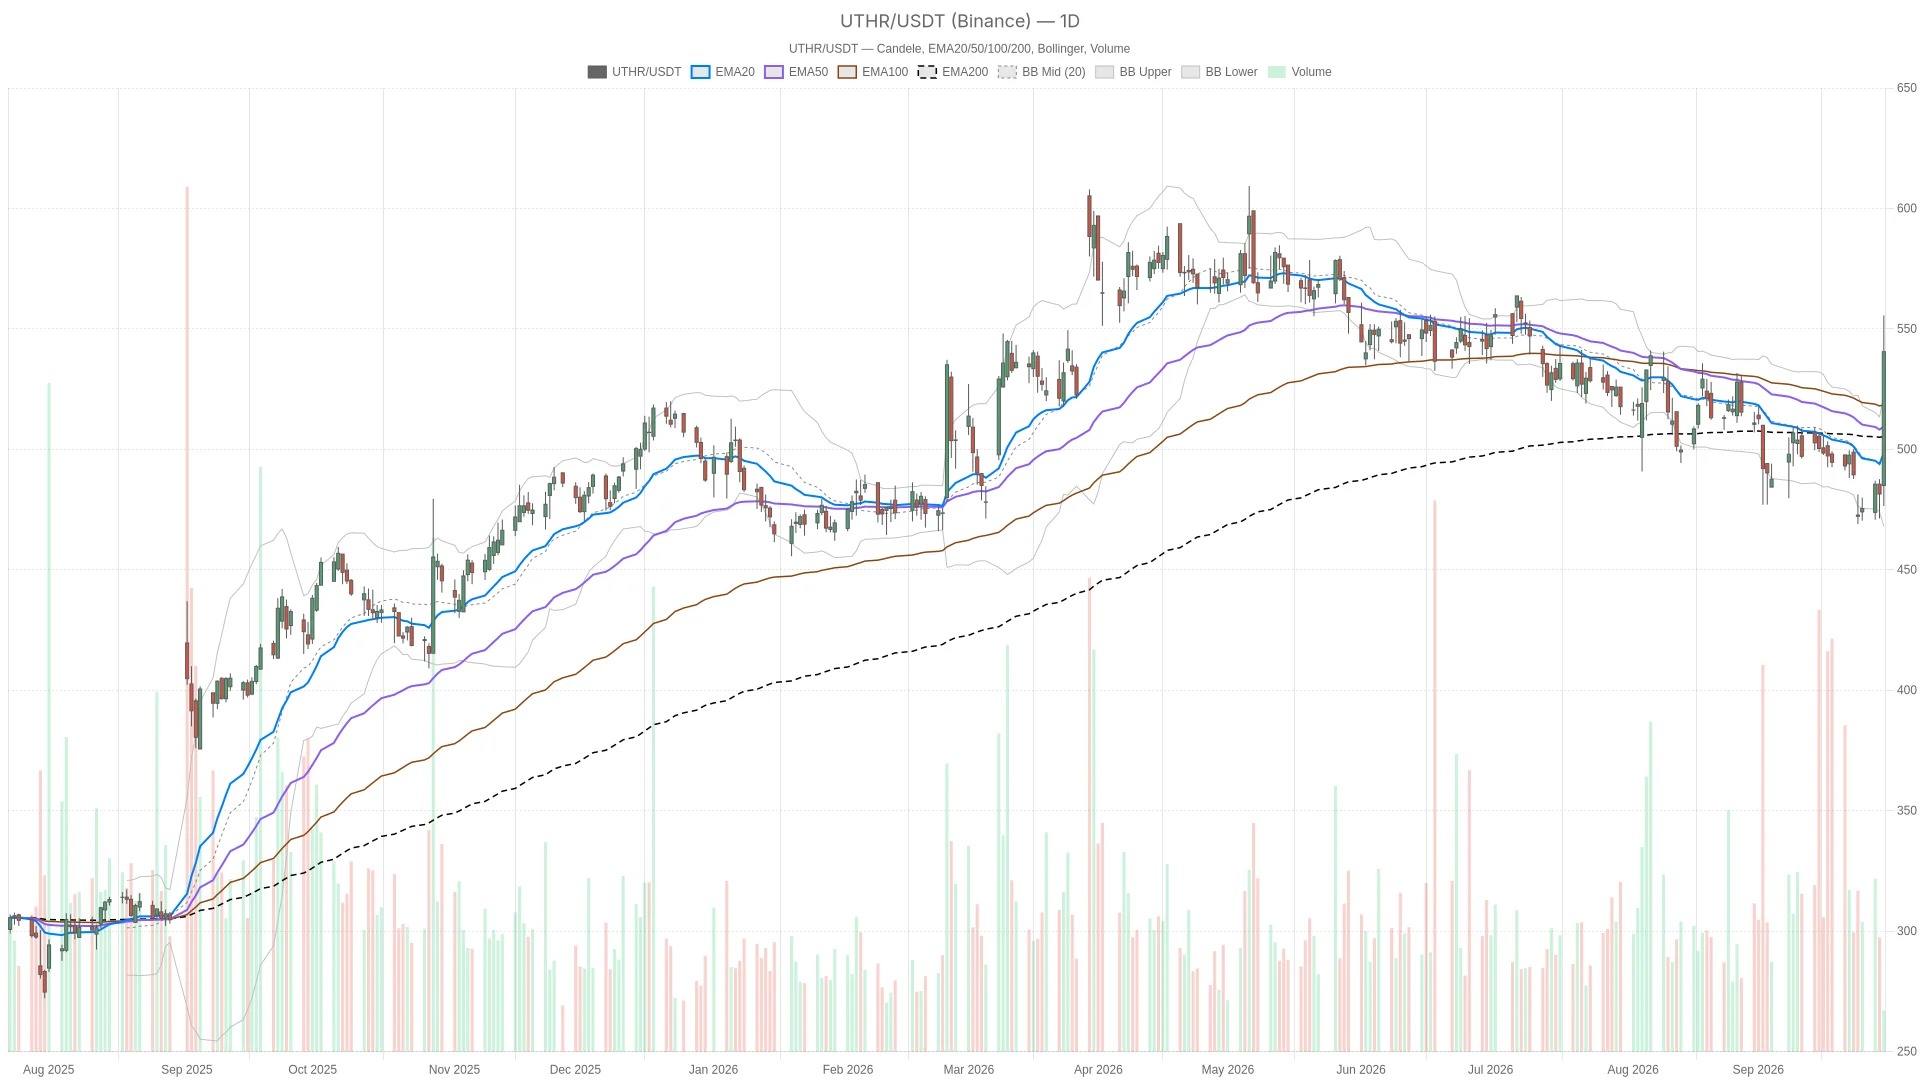
The daily chart shows that the stock of United Therapeutics has far exceeded its normal range of fluctuations. Today's candlestick is significantly larger than the 17.94 USD from 14 days ago for ATR, highlighting how abnormal this trading period is compared to recent history.
Today's daily candle opened at $484.99, and during the session it fluctuated between $476.47 and $555.59. Currently, it is trading at $540.54. The stock price is above all three daily moving averages: the 20-day EMA is at $498.38, the 50-day EMA is at $509.47, and the 200-day EMA is at $500.88. However, these moving averages do not form a clear bullish pattern on their own. The 50-day EMA is above the 200-day EMA, and the 200-day EMA is in turn higher than the 20-day EMA. In fact, the longer-term trend structure has not yet caught up with today's sharp rise.
The daily line RSI is at 65.38, indicating that the bullish momentum is strengthening, but it has not yet entered the extreme overbought area. MACD provides a more detailed signal: the MACD line is at -3.81, still below the zero axis, but it is already above the signal line of -6.81, and the bar chart has turned positive at 3.01. This suggests that a bullish crossover is forming. However, this signal appears against the backdrop of a negative MACD, so it is more indicative of a strengthening momentum rather than an established upward trend.
At the same time, the Bollinger Bands structure further strengthens the judgment of "overextension." The upper band of the daily Bollinger Bands is at $522.47, while the stock price of $540.54 is clearly above this level. This is a true breakthrough beyond the normal daily range of fluctuations, rather than a conventional advance towards a resistance level. The daily pivot point of $524.20 has also been broken through. The stock price is currently moving towards the r1 level of $571.93, while the s1 level of $492.81 is far below the current level.
Hourly chart momentum confirms a breakout, but overbought warnings intensify.
The hourly chart confirmed this breakout with a strong MACD reading. However, when RSI reached 78.94, it signaled that United Therapeutics stock was severely overbought within this time frame.
It is worth noting that the reading on the hourly chart RSI is 78.94, firmly within the overbought range. At the same time, MACD is significantly higher during this period. The value of MACD is 12.74, which is much higher than the signal line of 4.78; the bar chart shows a value of 7.96, indicating both stronger intensity and greater certainty than the daily chart readings. The upper band of the hourly Bollinger Bands is at 538.97 US dollars, while the stock price of 540.54 US dollars is slightly above this level. This once again indicates that the market is breaking through its normal short-term fluctuation range.
In terms of pivot points, the hourly chart pivot point is at $542.91, which is currently slightly higher than the latest price. The s1 level is at $537.63, serving as a nearby support. In other words, the stock price has fallen slightly from its intraday high and is now consolidating below its own pivot point. This detail is very important for those looking to determine the right entry timing, not just for those who are observing the larger trend.
15-minute chart: Consolidation near the pivot point
The 15-minute chart presents the clearest bullish structure across all time frames. However, United Therapeutics stock is consolidating near its pivot point instead of continuing to rise, and MACD also shows that its upward momentum is weakening.
In this cycle, the moving averages are arranged in a standard bullish pattern. The 20-week moving average is at $525.32, which is higher than the 50-week moving average of $504.37, and the 50-week moving average is in turn higher than the 200-week moving average of $491.63. The stock price is at $540.54, above all three moving averages, confirming that the short-term upward trend is still technically intact.
At the same time, RSI is at 68.79, indicating healthy bullish momentum, but it has not yet reached extreme pressure levels. It is worth noting that MACD for this cycle tells a story of weakening momentum. MACD at 16.79 is only slightly higher than the signal line of 16.05, and the bar chart has narrowed to 0.75. This flattening trend suggests that the most intense wave of buying may have passed, although the overall structure is still bullish.
Unlike the daily and hourly charts, the price on the 15-minute chart is still comfortably within the Bollinger Bands. The middle band is at $519.66, and the upper band is at $580.39. This creates a clear contrast: the shorter time frame is calmly digesting this upward movement, while the daily and hourly charts show that the price has already exceeded its respective bands of volatility. The pivot point on the 15-minute chart is at $540.79, which is roughly where the current price is located. The stock price is trapped between $539.76 (marked as s1) and $541.58 (marked as r1), creating a very narrow range with no clear direction, suggesting a short-term consolidation rather than an immediate continuation of the upward trend.
Clear differences in views on Wall Street
There is indeed disagreement on United Therapeutics stock on Wall Street. Goldman Sachs has given a 'sell' rating with a target price of $321; however, Seeking Alpha and Yahoo Finance believe that the stock is still undervalued.
The technical trend occurred against the backdrop of significant disagreements among analysts. Goldman Sachs analyst Andrea Newkirk first covered the stock on September 24, giving a 'sell' rating and a target price of $321, on the grounds that the stock's trading price was above its historical valuation range, while its core business was contracting. However, the firm is still believed to think that there will be real catalysts in 2027. According to reports by Yahoo Finance, this view caused the stock price to fall by 4% on the following trading day, but that happened before today's rebound and should not be confused with today's trend.
On the other hand, an article published by Seeking Alpha in the same week presented a "buy" perspective. The article argued that the business segments that investors are concerned about account for only about 32% of the company, while the profitability after tax standardization is $1.05 billion. Another article by Yahoo Finance interpreted the subsequent decline as a buying opportunity, citing a statement that the stock is still undervalued by 29% – this figure comes from the media's own analysis. According to a report by Investing.com, the chairman and CEO of United Therapeutics sold $4.7 million worth of shares. This adds the context of insider selling to the broader valuation debate, but it still does not explain today's price fluctuations.
Bullish scenario: There is still room to extend towards $571.
The bullish logic for this stock depends on whether it can hold the daily pivot point of $524.20. If it can, there is still hope that the stock will continue to move towards the resistance level of $571.93.
For the bulls, the key lies in whether they can sustain the breakout level that has already been achieved. If the stock price can remain above the upper band of the daily Bollinger Bands at $522.47, rather than quickly falling back within the bands, this will support the judgment that "this is a genuine re-pricing, not just a one-day spike."
On the hourly chart, bulls hope that the stock price will re-establish and hold above the pivot point of $542.91, while also not falling below the support level of $537.63. Therefore, a re-expansion of the 15-minute bar chart – currently only at 0.75 – would be the clearest short-term signal that buying pressure is resurging rather than weakening during consolidation.
Bearish scenario: The risk of mean reversion is on the rise.
The bearish logic mainly revolves around how stretched the stock United Therapeutics has become. On the hourly chart, RSI is at 78.94, which is in a deeply overbought area, and at the same time, the stock price is above both the daily and hourly trend lines.
Historically, this combination increases the probability of mean-reversionary pullbacks, even when the overall trend remains positive.
However, if the pivot point of 542.91 dollars on the hourly chart is breached and then falls below s1 at 537.63 dollars, that would be an early warning sign. If it continues to fall further and retracts to the daily chart range of EMA – between the 200-day moving average of 500.88 dollars and the 50-day moving average of 509.47 dollars – that would become the actual target.
If it further falls below the midband of the daily Bollinger Bands at $495.22 and the 20-day EMA at $498.38, then the bullish logic established by today's upward movement will be completely weakened. The daily EMA structure has not confirmed a clear bullish pattern. Although Goldman Sachs' target price of $321 is not a technical level, it still serves as a noteworthy bearish anchor point for those weighing valuation against the current price.
Conclusion
Overall, United Therapeutics stock is experiencing a strong intraday breakout amidst a series of overbought readings that usually indicate at least some sort of pullback. Both the daily and hourly charts show that prices have broken through the normal range of fluctuations; meanwhile, the more stable and orderly 15-minute chart indicates that the current momentum may be pausing rather than continuing to expand. There is also disagreement on Wall Street itself, with Goldman Sachs' "sell" rating and target price of $321 contrasting with the "buy" arguments for Seeking Alpha and the claim that its value is significantly undervalued.
In this environment, the dominant factor is volatility, not direction. Positioning around such a stretched trend carries real risks in both directions. Since no new corporate-level catalysts were confirmed during today's trading session, the next few trading sessions, as well as whether the stock price can hold the daily pivot point of $524.20 or the hourly pivot point of $542.91, may be more indicative than today's candlestick.
Frequently Asked Questions
What caused the United Therapeutics stock to rise by more than 12% today?
The current company news circulating does not explain this rise. The latest headlines are from two to four days ago, focusing on Goldman Sachs' "sell" rating and the subsequent 4% decline. There is no direct trigger for this fluctuation recorded in the current news.
United Therapeutics What is the bullish scenario for stocks?
The bullish logic depends on holding the daily pivot point of $524.20, which will preserve the path to advance towards the resistance level of $571.93. The bulls also hope that the stock price will re-cross above the hourly pivot point of $542.91, while not falling below the support level of $537.63.
What are the key overbought warnings?
The hourly line RSI is at 78.94, firmly within the overbought range. The stock price is also above the upper band of the Bollinger Bands on both the daily and hourly charts – this combination historically increases the probability of a mean-reversion correction.
What is Goldman Sachs' stance on United Therapeutics stock?
This article was generated with the assistance of artificial intelligence and has been reviewed by an editorial team.