

Key Points
- Spot DOGE ETF attracted $327,360 in capital inflows, recording a net inflow for three consecutive weeks.
- The long-short ratio of CoinGlass has risen to 1.01, indicating a slight bullish trend.
- Maintaining a level of around $0.093 for the 200-day EMA helps to sustain the outlook for a rebound, with $0.102 serving as a resistance level.
Dogecoin continued its rebound on Monday, with trading prices above $0.096 supported by ongoing capital inflows of ETF and improved derivative positions.
This meme coin found support near a key technical level last week and is still above its main daily moving average. However, the momentum indicators show a mixed picture, indicating that buyers still hold the upper hand, but there has not been a clear acceleration yet.
The immediate test at hand is whether DOGE will be able to hold above the 200-day moving average of around $0.093 ( EMA ) and gain enough demand to challenge the resistance level of $0.102.
DOGE ETF Continuation of capital inflow
According to SoSoValue data, the spot Dogecoin ETF recorded a net inflow of $327,360 last week.
This positive total indicates that funds have been flowing in for the third consecutive week, showing that investors continue to increase their exposure through these products.
Although this continuous inflow has supported the demand side, the ETF capital flow is just a part of the Dogecoin market. The relevant data cannot prove that each transaction comes from institutional investors, nor can it indicate that the buying orders through these funds will outweigh the selling orders from other channels.
If the subsequent cash flow continues to be positive, especially with an increase in allocation, it will further strengthen the rebound logic. On the contrary, if the inflow slows down or reverses, it will weaken one of the supporting factors behind the current upward trend.
For now, the most important signal is continuity: these funds have maintained net buying for three consecutive weeks.
CoinGlass data shows that the long-to-short ratio of Dogecoin is 1.01 on Monday, slightly higher than the neutral threshold of 1.
This reading indicates that the long positions in this dataset are slightly in the majority. Sentiment has improved, but since the value is close to 1, the positions are still nearly balanced, rather than being overwhelmingly bullish.
The funding rate for DOGE also supports this judgment. Since it became official on September 10th, it has risen to 0.0092% on Mondays.
A positive funding rate means that long traders pay fees to short traders, which usually reflects a stronger demand for bullish positions in perpetual contracts.
However, the funding rate is merely a position indicator, not a price forecast. If prices weaken, even if sentiment is positive, long positions that use leverage may still face pressure.
Overall, these two readings indicate that confidence is improving, but they also remind the market to remain cautious about the strength of traders' beliefs.
200-day EMA support for a rebound
As long as the price remains above the 200-day EMA of around $0.093, the short-term technical outlook for Dogecoin remains positive.
The shorter-term moving averages are below this level, with the 50-day EMA at around $0.088 and the 100-day EMA at around $0.086.
Standing above these three moving averages helps to support the current rebound structure. The 200-day EMA is particularly important as it constitutes the nearest major support below the current price level.
The Relative Strength Index ( RSI ) is close to 58, indicating positive momentum, but has not yet entered the overbought zone.
However, the Moving Average Convergence Divergence indicator ( MACD ) has slightly slipped into negative territory, indicating that the upward momentum is weakening. DOGE may need to consolidate further before attempting a more robust rise.
The first obvious resistance level for an upward trend is at $0.102, which is about 6% higher than $0.096. If this level can be continuously broken through, it will strengthen the rationale for a continued rebound.
The buyer needs to maintain the breakout, rather than falling back after a brief breakthrough of resistance.
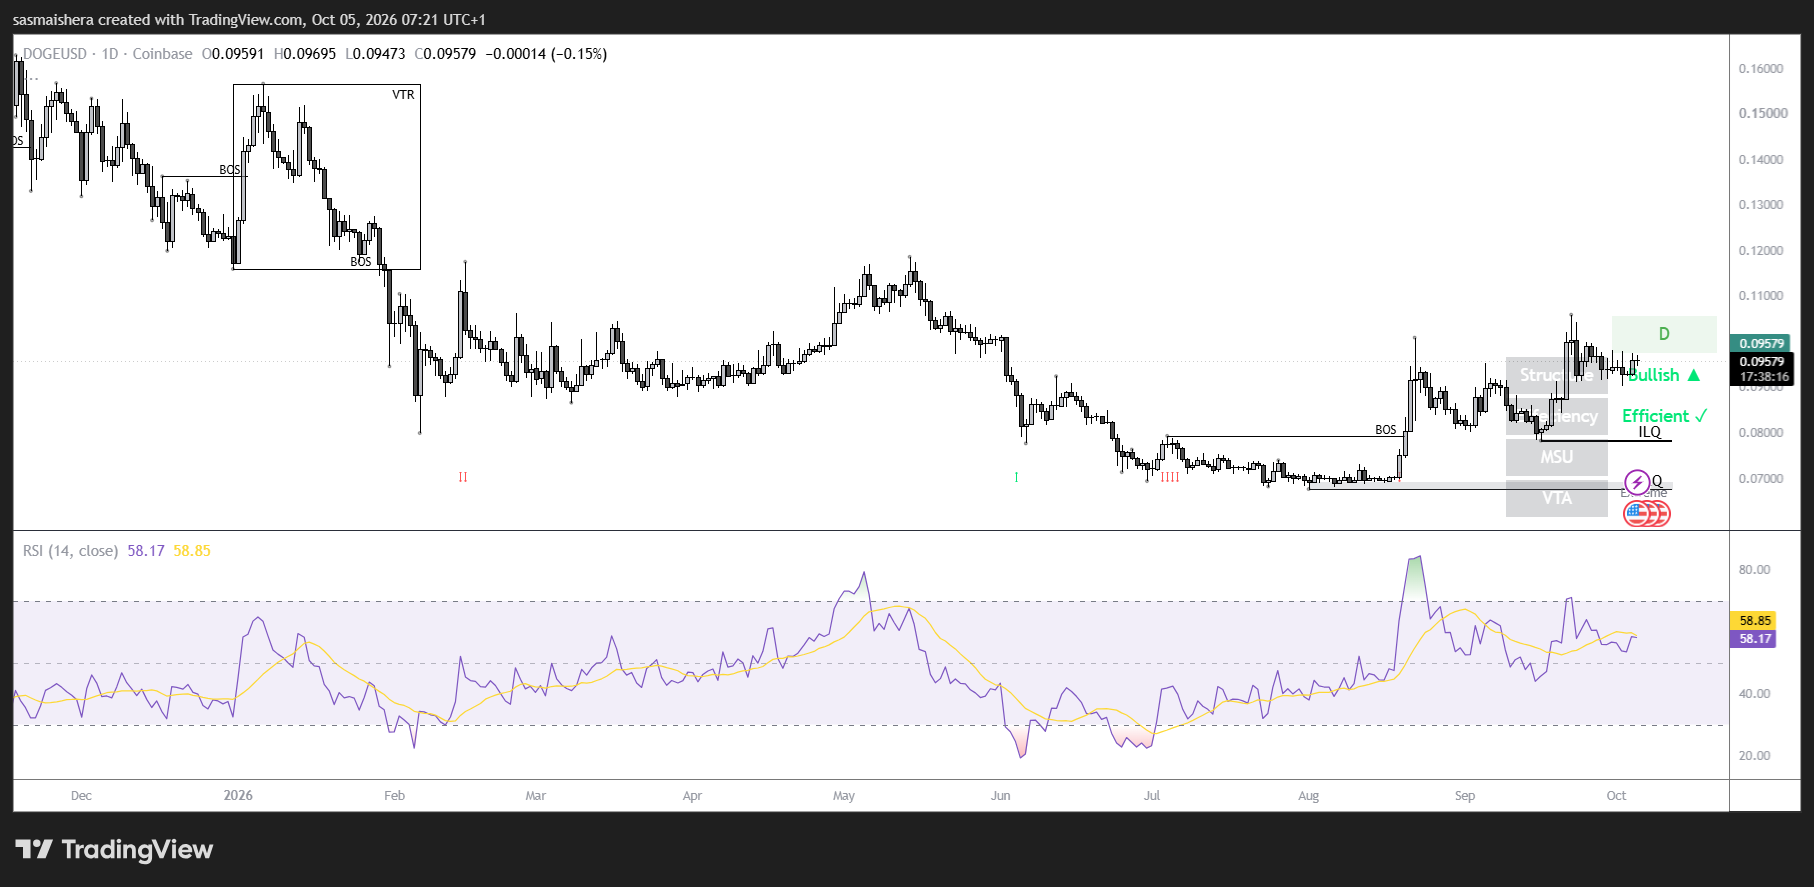
On the downside, once it falls below $0.093, the support level of $0.088 and the nearby 50-day EMA will come into view. The next moving average support is around $0.086, with more distant structural support at $0.070.
Therefore, the outlook for DOGE remains cautiously positive. Continuous buying pressure from ETF and favorable derivative positions may provide support, but holding above $0.093 and breaking through $0.102 remain key price challenges.