

Key Points
- PI On Monday, trading was around $0.0865, continuing the downward trend, with a fifth consecutive trading day of declines.
- The number of open futures contracts rose to 10.15 million US dollars, higher than the previous 9.78 million US dollars, indicating an increase in open positions.
- Support levels are at $0.0827 and $0.0801, while the initial resistance level for a rebound is at $0.0911.
Despite a more optimistic overall market sentiment, Pi Network continues to show a downward trend.
Pi Network Continued to weaken on Monday, with the price falling below $0.090, and the consecutive declines have extended into the fifth trading day. The token is currently trading at around $0.0865, and despite a relatively positive sentiment in the broader cryptocurrency market, it continues to face pressure.
According to the data from CoinMarketCap, the overall Fear and Greed Index is at 67, which falls within the "greedy" range. This reading indicates that market participants still have a risk appetite, but this optimism has not yet translated into a sustained rebound in PI.
This differentiation highlights the importance of the token's own price structure. Although broader market sentiment can provide a context, the decline in the PI price and weak momentum indicators indicate that buyers have been struggling to regain control of the situation.
Its next move will depend on whether the nearby support level can attract enough demand to stop the decline, or whether the selling pressure will push the token towards its recent lows.
CoinAnk Data shows that the open interest in PI futures amounted to 10.15 million US dollars, which is an increase of about 3.8% from the previous day's 9.78 million US dollars. This indicates that while spot prices continue to fall, the open position in derivatives has slightly increased.
Unclosed contracts measure the notional value of active contracts. An increase in this number indicates that participation continues, but it does not reveal whether these positions are predominantly long or short.
For traders holding leveraged long positions, the continuous weakening of the spot market poses risks. The increase in open contracts while prices fall makes the direction and resilience of this exposure more noteworthy, however, the data provided does not indicate which side is at an advantage.
Moving averages and momentum indicators are still biased towards the sellers.
PI remains below its main daily exponential moving average, reinforcing the bearish technical outlook.
The 50-day EMA is at $0.0911, which is higher than the current price and constitutes the first resistance level for a rebound. The 100-day EMA is around $0.0991, while the 200-day EMA is significantly higher, at $0.1219.
This arrangement shows that PI has still not regained the short-term trend reference level, nor has it recovered the moving averages related to the broader price direction.
At the same time, MACD remains slightly negative. The readings of RSI and MACD collectively support a cautious judgment in the short term, with sellers still holding a technical advantage.
The immediate support level is at $0.0827, which corresponds to the 23.6% Fibonacci retracement level calculated from the range of $0.1341 to $0.0704. The low point on July 31st, at $0.0801, provides another nearby reference level.
If PI loses these levels, the 0.0704 USD range low will become the next downward area that needs attention. If prices move towards that level, it would indicate that the current downtrend is continuing to extend, rather than confirming that a rebound has begun.
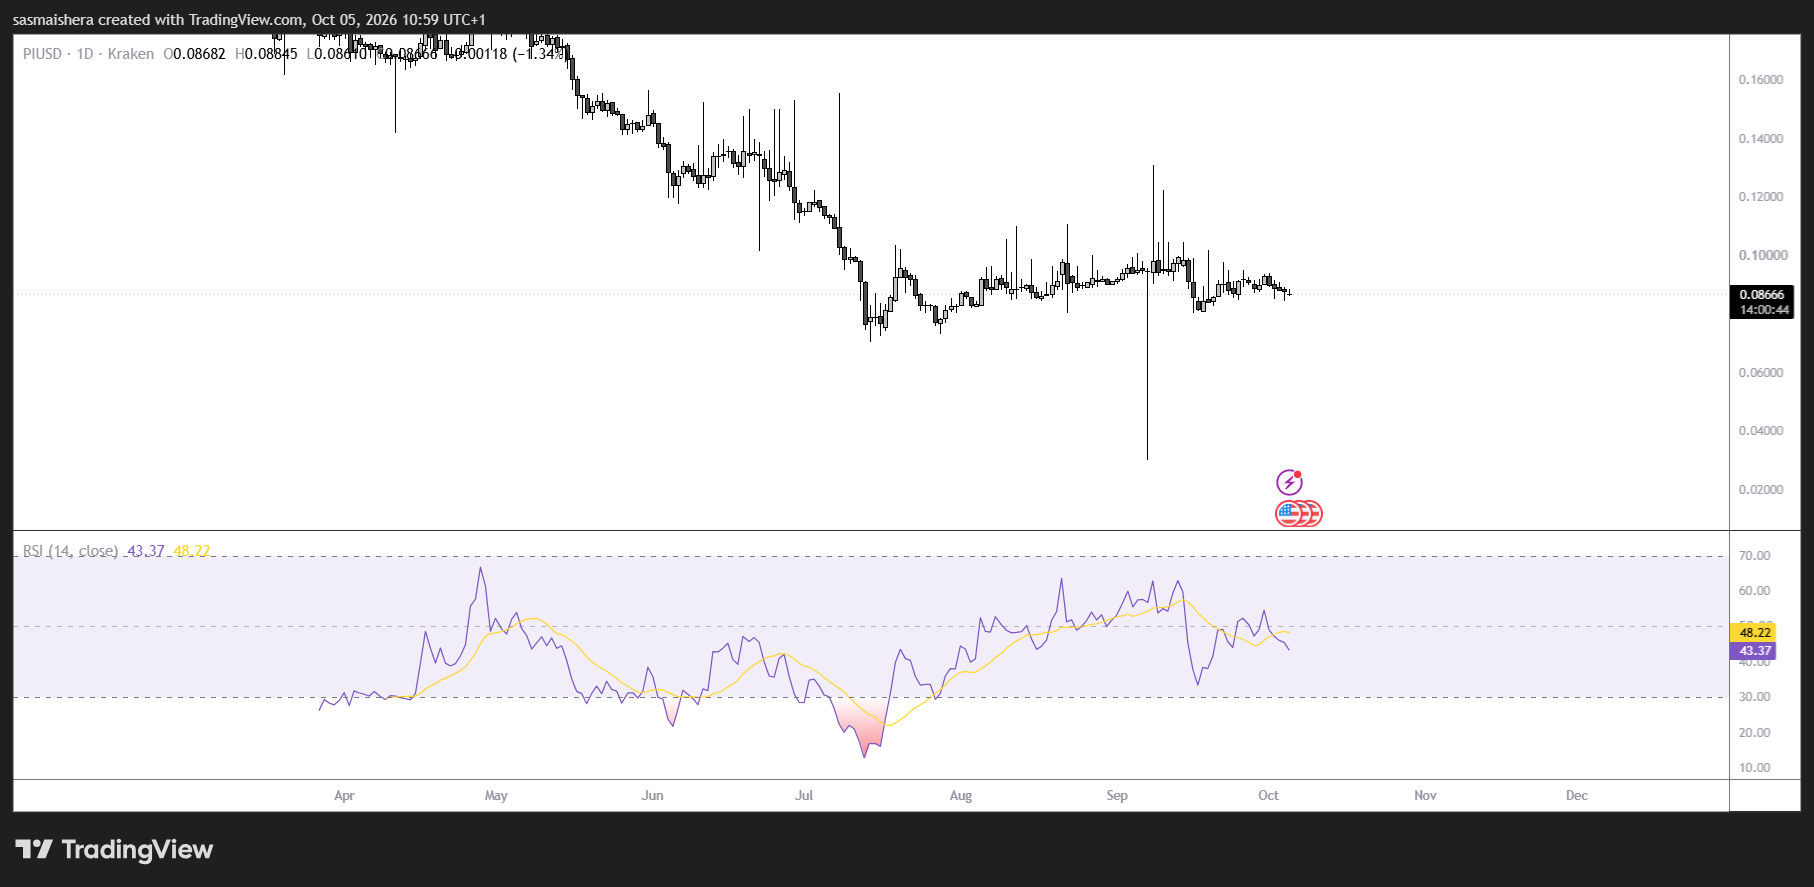
To recover, the buyer first needs to regain the 50-day EMA of $0.0911. Further above that, resistance is concentrated at the 50% Fibonacci retracement level of $0.0990 and near the 100-day EMA of $0.0991.
If it is able to retest these resistance levels, the technical outlook will improve. Until then, an increase in derivatives participation can only provide limited comfort for the ongoing price weakness of this token.