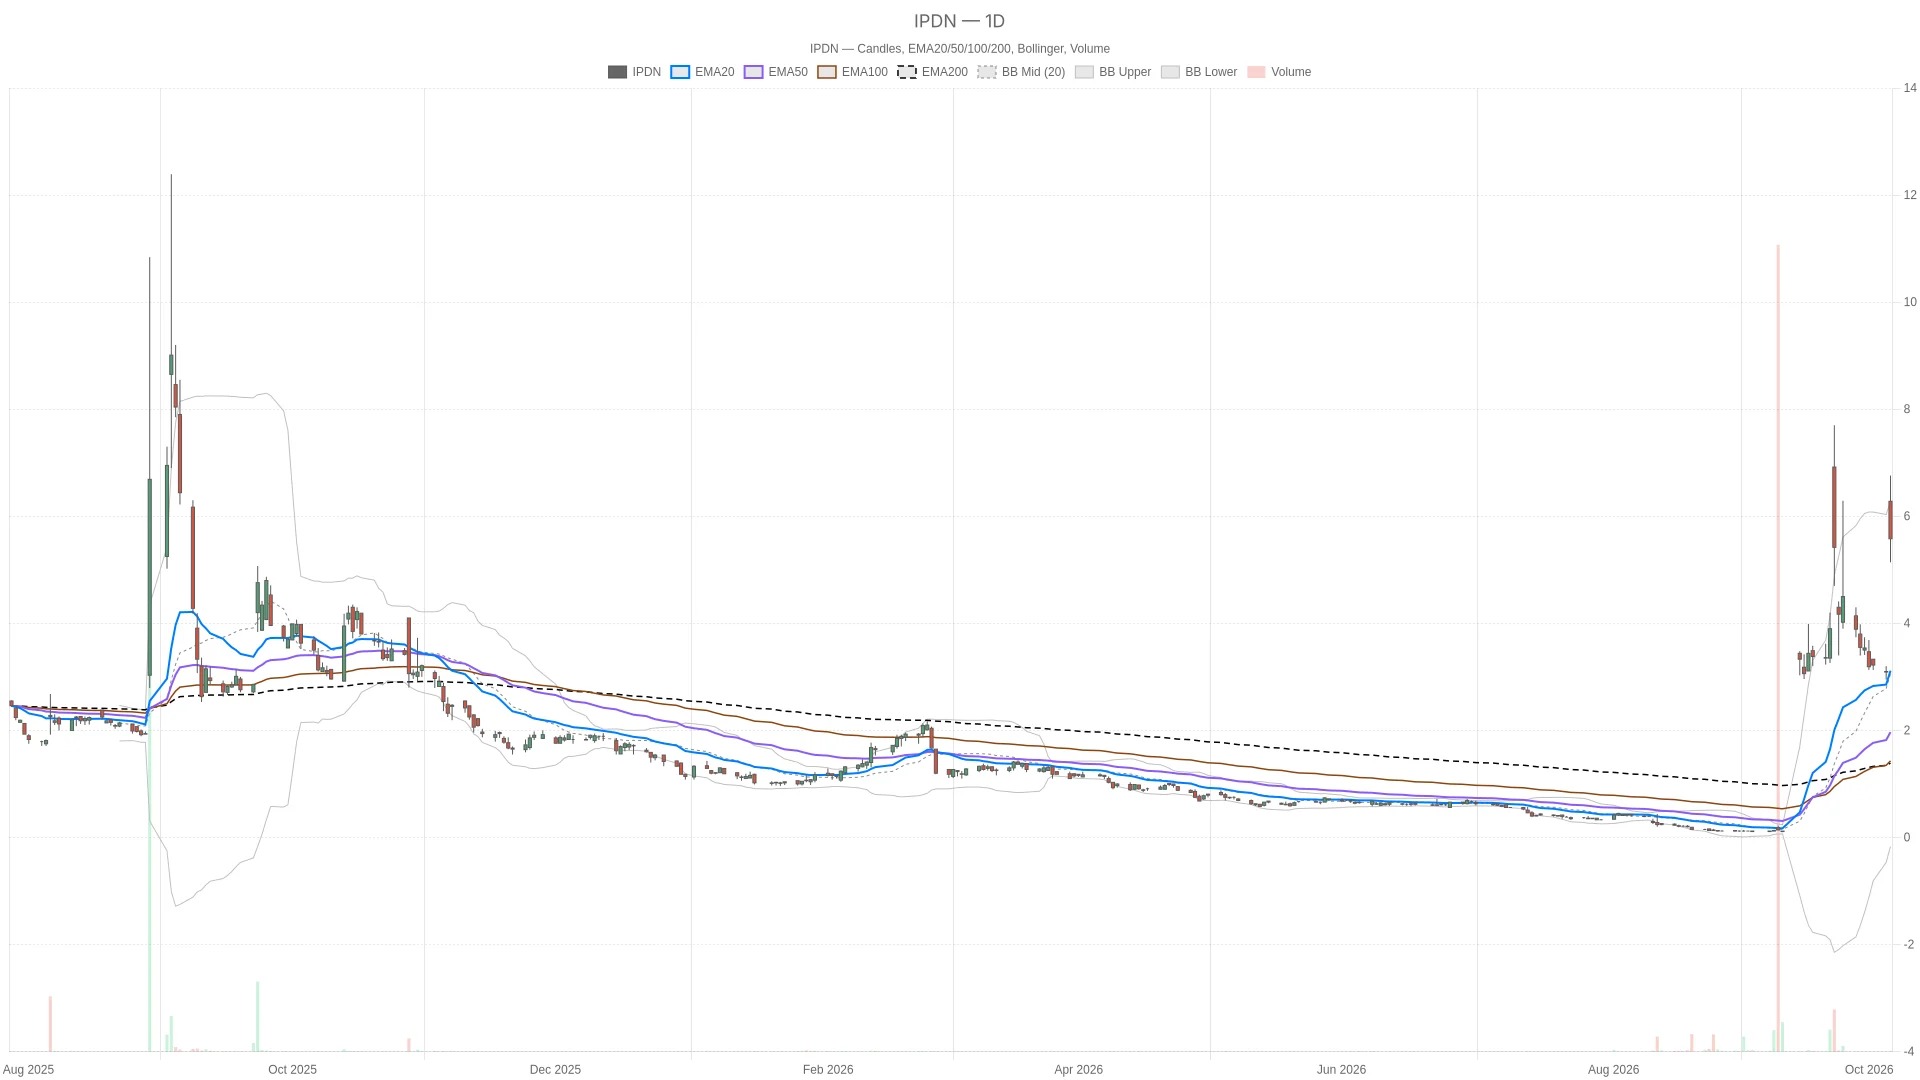
Professional Diversity Network ( IPDN ) On Tuesday, October 6, 2026, at 09:57 Eastern Time, the stock price was reported at $5.58, representing an 80% increase from the Monday closing price of $3.10. The stock opened at $6.28, with a trading range during the session of $5.14 to $6.76, and the trading volume reached 168,478 shares. This surge has redefined the technical landscape across various time periods.
Key Points
- The daily chart shows a stacked bullish arrangement: the price is higher than the 3.12 USD of the 20-day EMA, the 1.97 USD of the 50-day EMA, and the 1.46 USD of the 200-day EMA.
- The daily line RSI14 is at 72.4, the hourly line RSI14 is at 85.68 (higher than the previous 39.53), and the 15-minute line RSI14 is at 93.6; all are in overbought territory.
- On the daily chart, with the MACD bar chart showing a value of 0.01, it has turned from -0.11 to a positive value. The MACD line is at 0.86, which is higher than the signal line of 0.85.
- The pivot point for a 15-minute period is $5.68, the first resistance level ( R1 ) is $6.22, and the first support level ( S1 ) is $4.60; the current price of $5.58 is slightly below the pivot point.
Professional Diversity Network Stock: Daily Moving Average
The price is above all three moving averages, which are arranged in a stacked pattern. The 20-day EMA is at $3.12, the 50-day EMA is at $1.97, and the 200-day EMA is at $1.46, all of which are below the current price. This structure maintains a predominantly bullish trend for the daily time frame. The daily RSI14 reading is 72.4, which indicates an overbought area, confirming the strength of the upward movement and also suggesting that this trend has become somewhat extended.
Daily Chart MACD and Volatility

On the daily chart, MACD has turned positive, crossing above the zero line to reach 0.01, from a previous value of -0.11. MACD is at 0.86, slightly higher than the signal line of 0.85, forming a minor bullish crossover that is in line with the broader bullish outlook. Meanwhile, on the daily chart, ATR14 has risen from 0.70 to 0.91, indicating a surge in price accompanied by a noticeable increase in volatility.
Daily Bollinger Bands and Pivot Levels
The price is also below the upper band of the daily Bollinger Bands at $6.28, while it is significantly higher than the middle band of $3.06. According to the daily pivot level calculated from the candlestick chart of Monday, the pivot point is $3.08, the first resistance level ( R1 ) is $3.22, and the first support level ( S1 ) is $2.97. The current price is far above all three of these levels, indicating that there has been a significant advance during trading on Tuesday, moving away from the closing price of the previous candlestick.
Hourly chart: Confirmation of an upward trend, but also indicates overextension.
The hourly chart confirms this bullish trend, but it also shows obvious overextension. The price is still above all three hourly moving averages, however, the order of these moving averages is inverted: the 200-hour moving average is at $4.52, which is higher than the 50-hour moving average at $3.52, and the 50-hour moving average is in turn higher than the 20-hour moving average at $3.42. This structure makes the daily outlook more complex, rather than just a simple confirmation of the bullish trend.
Hourly Momentum and Volatility
The hourly RSI14 value soared from 39.53 to 85.68, entering a deeply overbought range and far exceeding the daily average of 72.4. The hourly MACD bar chart increased from 0.02 to 0.18, and the MACD line at 0.07 is above the signal line of -0.11, forming a clear bullish pattern over this shorter time period. However, the hourly ATR14 value is at 0.38.
At the same time, the price is also significantly higher than the upper band of the hourly Bollinger Bands at 4.36 US dollars. The hourly pivot point, as well as the first resistance and support levels, are all concentrated around 3.10 US dollars, a level that is related to the closing price on Monday; however, the current price has already far surpassed that level. Compared to the clearer structure on the daily chart, the hourly chart indicates that the market has made a substantial upward move, and the momentum readings are also at a notably high level.
15-minute chart: Background at the execution level
The 15-minute chart indicates that the short-term trading level is in a state of extreme overbought conditions. RSI14 has risen further from 92.26 to 93.6, still within the overbought range. On the 15-minute MACD bar chart, the value has increased from 0.15 to 0.25, and the MACD line is at 0.31, which is 0.05 higher than the signal line, continuing to confirm the upward pressure for this intraday period.
At the same time, the 15-minute moving averages are not arranged in a bullish order: the 50-period EMA is at $3.34, which is lower than the 20-period EMA at $3.49; the 20-period EMA is in turn lower than the 200-period EMA at $3.57, with prices above these three moving averages. The 15-minute pivot point is at $5.68, the first resistance level (R1) is at $6.22, and the first support level (S1) is at $4.60. The latest price is close to $5.58, slightly below the pivot point, so $5.68 becomes the next intraday threshold. The 15-minute ATR14 has risen from $0.31 to $0.37, and the price is still above the upper band of the Bollinger Bands at $4.68.
It is worth noting that a search of recent reports did not find any company-level information that could explain the surge during this trading period.
Bullish and bearish scenarios
The bullish scenario is mainly based on the crossover of the stacked moving averages on the daily chart and the daily MACD line turning positive. To continue rising, the price first needs to re-cross above the 15-minute pivot point of $5.68, and then break through the first resistance level of $6.22. If it can hold above the upper band of the hourly Bollinger Bands at $4.36, and if the daily MACD line remains above the signal line, it will reinforce the belief that buyers are still in control, even though various indicators are already in an overbought state.
On the other hand, bearish risks are concentrated as short-term momentum readings are already too high. If the price falls below the first support level of $4.60 at 15 minutes, it will be the first warning signal; subsequently, if the price also breaks below the $3.42 level at the 20-hour EMA time frame, the risks will further increase. If the price at the 20-hour RSI14 time frame falls from $85.68 to around the neutral level of 50, or if the 15-minute candlestick chart breaks below the 0.05 signal line, it indicates that this sharp rise is losing its momentum during the session. The daily EMA20 level of $3.12 is far below the current price, and if that level is tested, it would mean a more substantial pullback.
Overall, Professional Diversity Network is at an unusual juncture: the daily chart shows a clear bullish accumulation of moving averages and a positive MACD crossover, yet the hourly and 15-minute charts indicate extreme overbought conditions, and the structure does not conform to a simple bullish pattern. As of 09:57 Eastern Time, the price was at $5.58, below the 15-minute pivot point of $5.68, but significantly higher than all the daily pivot levels calculated based on the Monday candlestick chart. ATR14 readings are available for every time frame, from the daily chart down to the 15-minute window.
Frequently Asked Questions
IPDN What key levels need to be watched after this wave of gains?
The 15-minute pivot point of $5.68 and the first resistance level of $6.22 are the current upward thresholds. On the 15-minute chart, the first support level ( S1 ) is at $4.60. On the daily chart, the pivot point is at $3.08, the first resistance level ( R1 ) is at $3.22, and the first support level ( S1 ) is at $2.97.
IPDN Has it become overbought after rising by 80%?
Yes, this is the case for all time periods. On the daily chart, RSI14 is 72.4, on the hourly chart, RSI14 is 85.68, and on the 15-minute chart, RSI14 is 93.6.
What does the daily moving average structure show?
The price is above all three daily moving averages: the 20-day EMA at $3.12, the 50-day EMA at $1.97, and the 200-day EMA at $1.46, forming a stacked bullish arrangement that provides a bullish bias for the daily time frame.
Cryptonomist and the author do not hold any positions in the financial instruments mentioned in this text, nor have they received any compensation from the companies reported.
This article was generated with the assistance of artificial intelligence and has been reviewed by an editorial team.