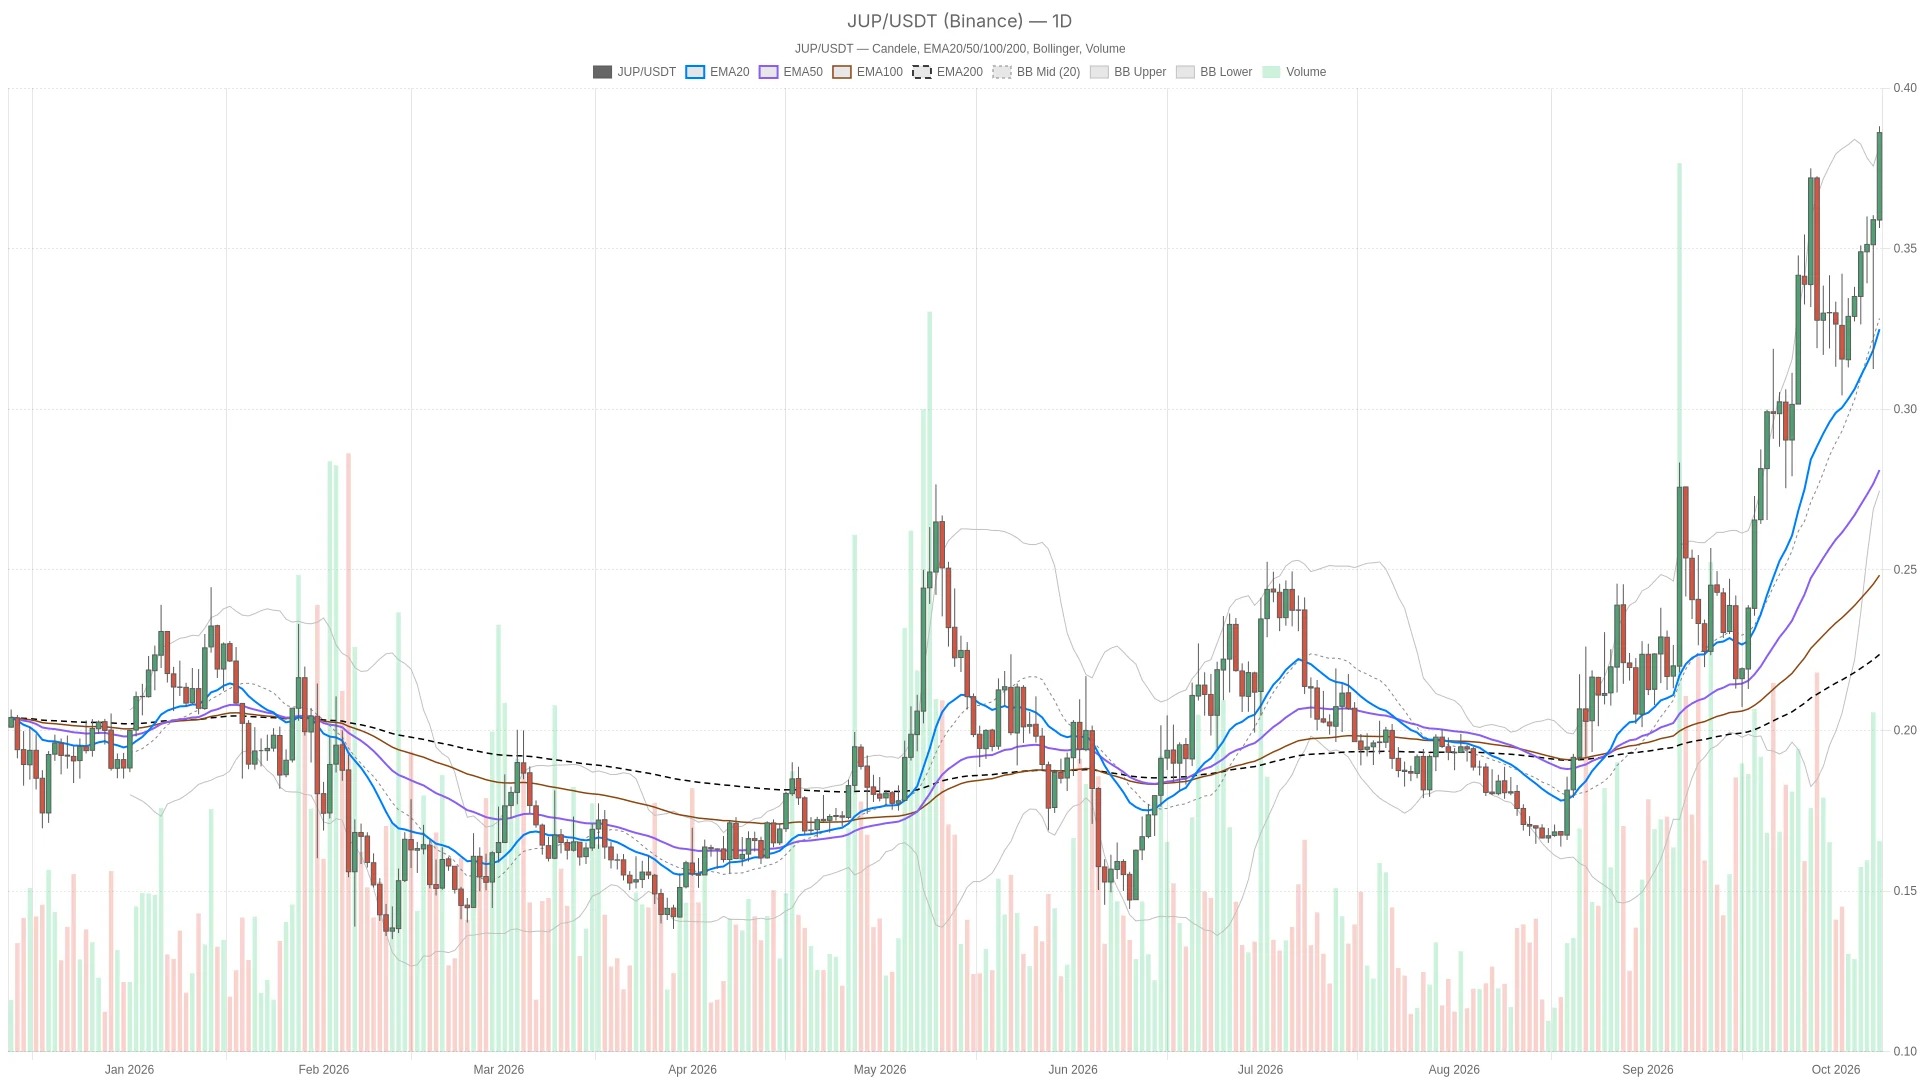
As of October 8, 2026, the price of Jupiter is 0.3861 US dollars, based on the real-time daily candlestick chart of JUPUSDT from Binance. The daily structure is quite complex, but the short-term settings are becoming increasingly stretched. The dominant technical force is still upward, however, the hourly momentum readings make a "sustained one-way rise" seem less certain.
Key Points
- Jupiter reported $0.3861 on Binance, above all three daily moving averages as well as the upper band of the daily Bollinger Bands.
- On the daily chart, RSI has risen to 66.9, indicating a bullish trend; on the hourly chart, RSI is in an overbought range at 80.6.
- Although the hourly MACD bar chart is positive, it is narrowing, showing a divergence from the rising hourly RSI chart, which weakens the short-term momentum.
- A close above $0.3918 per hour will confirm the continuation; a close below $0.3819 per hour will trigger a bearish pullback.
Jupiter Strong prices coexist with hourly momentum conflicts
The daily trend is upward, but there is disagreement regarding short-term momentum. The previous completed daily candlestick closed at $0.3590, which is lower than the $0.3754 level indicated by the R1 on the daily chart. The current real-time daily price has surpassed this level, but a confirmed daily breakout has not yet been established. Reaching a certain daily reference point during trading does not equate to truly holding that level at the time of daily closing.
The previous completed hourly candle closed at $0.3792, while the current real-time hourly price is $0.3862. The hourly structure confirms a bullish bias on the daily chart, but the evidence for momentum is not entirely consistent. In the time frame of execution, the current real-time 15-minute price is $0.3863, and the previous completed candle closed at $0.3869. This slight decline in itself does not prove a reversal of momentum.
The moving averages are aligned in support of the trend, but the price has extended beyond the Bollinger Bands.

The arrangement of moving averages across various time frames still indicates a strong structural trend, rather than just positive short-term momentum. The daily moving averages EMA20, EMA50, and EMA200 are located at $0.3185, $0.2768, and $0.2220, respectively. The price is above these moving averages, and their bullish arrangement provides a clear structural foundation for the daily trend.
The same arrangement is maintained on the hourly chart as well. The price is above $0.3533, which is EMA20, $0.3446, which is EMA50, and $0.3372, which is EMA200. It is also above $0.3745, which is EMA20 for the 15-minute time frame, $0.3619, which is EMA50, and $0.3451, which is EMA200. Both sets of moving averages are in a bullish alignment. Therefore, short-term pullbacks are possible while the larger-scale moving average structure remains intact.
The Bollinger Bands more clearly show the extent of extension. The price is above the daily Bollinger Band upper band at $0.3757 and the 15-minute Bollinger Band upper band at $0.3835, but below the hourly Bollinger Band upper band at $0.3918. The daily middle band is at $0.3222, and the lower band is at $0.2688. The market is extended relative to both the daily and hourly Bollinger Bands, while the hourly Bollinger Bands still have an upper reference level that remains to be tested.
The daily ATR is $0.02741, the hourly ATR is $0.007802, and the 15-minute ATR is $0.005546. These readings describe the range of fluctuations, not the direction; the nearby support and resistance levels should be understood in context with these fluctuations.
RSI is strengthening, while the hourly MACD momentum is weakening.
RSI is on the high side across various time frames, but the MACD at the hourly level is narrowing, while RSI continues to rise, creating a divergence that weakens short-term confidence. On the daily chart, RSI has risen to 66.9, supporting a bullish trend, but it has not yet entered an overbought zone. The hourly RSI has reached 80.6 and is already in an overbought state; the 15-minute RSI is also rising and is within the overbought range of 71.5. The strength is mainly concentrated in shorter time cycles, which are more prone to mean reversion.
MACD makes this picture even more complex. In the past three readings that have been completed, the daily bar chart has shifted from negative to slightly positive, reinforcing a bullish outlook on a larger scale. The hourly bar chart remains positive, but it is declining and narrowing in width; therefore, even though there is an increase at the hourly level, the upward momentum is weakening. The 15-minute bar chart has also entered a slightly positive range. Improvements at the execution level cannot eliminate the divergence between "strong" and "weak" trends at the hourly level. RSI MACD
The hourly resistance level of $0.3918 determines whether there will be a continuation or a failed breakthrough.
The hourly Bollinger Bands upper band is at $0.3918, which serves as the dividing line between a continuation of the bullish trend and a failed breakout. If the closing price stays above this level, it will confirm the bullish trend; however, if the closing price falls below the $0.3819 level of the R1 band, it will shift the short-term outlook towards bearish.
Bullish scenario: If the hourly close rises above the upper band of the hourly Bollinger Bands at $0.3918, it will confirm the continuation and break through the most recent upper reference level. This trigger condition is not yet met: the previous completed hourly close was at $0.3792. If the hourly close falls below $0.3819, then this continuation structure will become invalid. No higher resistance levels are mentioned in the text, so there is no upward target above that trigger level.
Bearish scenario: If the hourly close falls below $0.3819, which is the R1, it will confirm a short-term resistance level, and the hourly pivot point of $0.3769 will become the focus of attention. Below that are the daily Bollinger Band upper band at $0.3757, the daily R1 at $0.3754, and the hourly S1 at $0.3742. If the hourly close manages to rebound above $0.3819, then this bearish structure will be invalidated. This will first be regarded as a pullback rather than evidence of a reversal in the daily trend.
The daily pivot point of $0.3440 and the S1 daily level of $0.3275 represent deeper structural references, rather than immediate breakouts at the current time. According to this interpretation, the most likely false signal would be a brief price breakthrough above the hourly upper band that is not sustained at the end of the hour. The overheating of the short-term RSI and the narrowing of the hourly MACD increase this risk; conversely, if the price only briefly falls below the hourly R1 without confirming a close below it, a bearish scenario cannot be established based on that.
Greedful sentiment accompanies a weaker overall market backdrop.
Market sentiment reading is 64, which falls within the “greedy” range, but the broader market is not considered strong. Over the past 24 hours, the total market value of cryptocurrencies has declined by 3.32%, which suggests that the strength of Jupiter is more of a localized signal rather than evidence of an overall bullish environment. The Fear & Greed Index for Alternative.me is 64, classified as “greedy.” CoinGecko indicates that the total market value of the crypto market is $2,834,289,231,355.01, with a 24-hour change of -3.32%; Bitcoin accounts for 58.77% of this value. The contrast between constructive sentiment and the decline in market value indicates that the bullish technical structure for Jupiter is a localized development.
Frequently Asked Questions
Does the quote of $0.3861 represent the completed daily closing price?
No. $0.3861 is the real-time daily candlestick price. The previous completed daily candlestick closed at $0.3590.
Does an overbought reading indicate a bearish outlook for the daily chart?
No. Overbought readings appear on the hourly and 15-minute charts. The daily chart still indicates a bullish trend, while shorter time frames show tension between strong RSI and weakening hourly MACD momentum.
What would confirm the continuation of the bullish trend for JUP?
The hourly close reached the upper band of the hourly Bollinger Bands at $0.3918, confirming the continuation and breakout of the recent upper reference level. Before such a close occurs, the bullish scenario remains to be confirmed.
This article was generated with the assistance of artificial intelligence and has been reviewed by an editorial team.