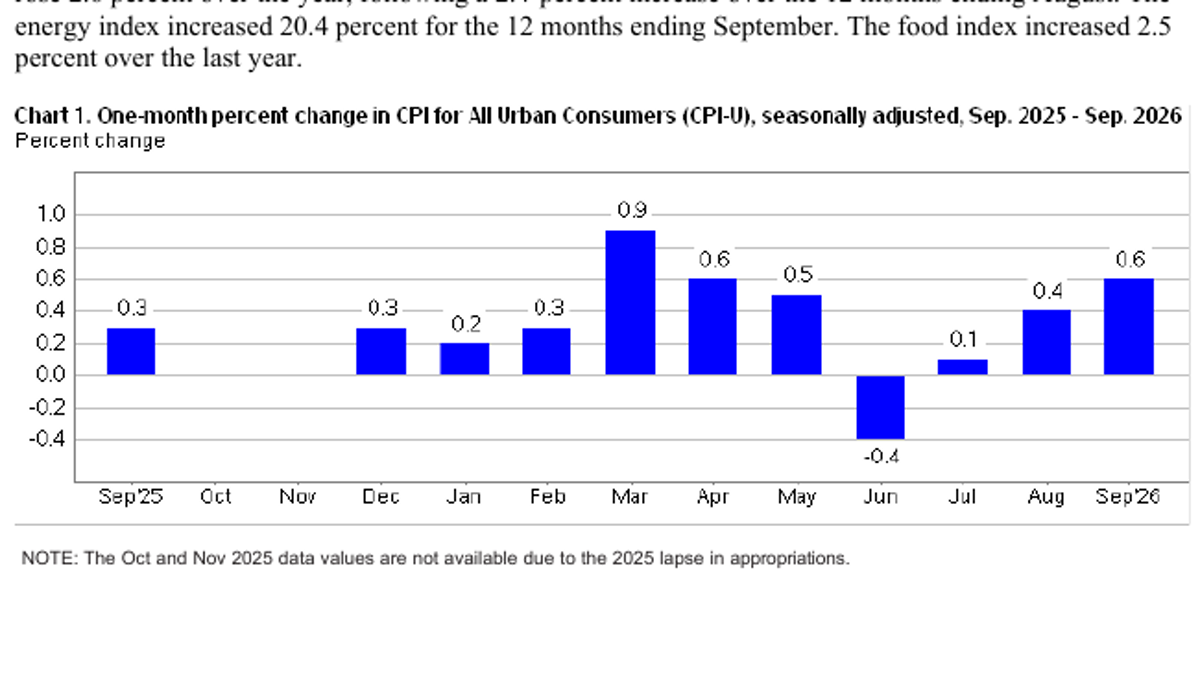
The U.S. Bureau of Labor Statistics released the Consumer Price Index for September on October 14th, providing a rather significant answer to the market: the seasonally adjusted total index rose by 0.6% month-on-month, higher than the 0.4% in August; the year-on-year increase rose to 3.7%, from 3.4% in August. Beyond the headline figures, the most crucial indicator this month is gasoline. Officials stated that the gasoline index increased by 9.1% month-on-month, contributing more than half of the total index's monthly rise. If readers only see "inflation is rising again," they might misinterpret this energy shock as a simultaneous acceleration in the prices of all goods and services; however, if one only says "it's all due to gasoline," they would also overlook the ongoing pressures on housing and other categories.
The constituent data from the Bureau of Labor Statistics provides a more detailed picture. The energy index rose 5.2% on a month-over-month basis, compared to 2.1% in August; the housing index rose 0.4% month-over-month, whereas it was 0.3% in August; the overall food index remained flat for the month, with dining out increasing by 0.2% and household food costs decreasing by 0.1%. Excluding food and energy, the core CPI index rose 0.3% month-over-month, the same as in August; year-over-year, it increased from 2.4% to 2.6%. These figures cannot be directly added together to explain the total index, as the weights of each component and the seasonal adjustment methods differ. However, they are sufficient to indicate that the price changes this month cannot be summarized by a single figure.
Oil prices were the star of the month, but the core price did not return to zero.
The increase in gasoline prices often affects households more quickly than the prices of many services and also impacts market expectations more swiftly. In September, the gasoline index rose by 34.2% year-on-year, while energy costs as a whole increased by 20.4% year-on-year. These increases indicate that energy has a significant impact when compared on an annual basis. However, the year-on-year growth rates are also influenced by the base level from last year; therefore, a 34.2% increase cannot simply be attributed to the recent month alone. The 9.1% monthly increase and the 34.2% annual increase address two different issues. Both reports and investment analyses should clearly define the comparison periods being used.
The core index maintained a month-on-month increase of 0.3%, which indicates that even after excluding the more volatile categories of food and energy, prices continued to rise. The official data listed increases in categories such as entertainment, used cars and trucks, education, airfare, medical care, and clothing for that month, with communications being one of the few major categories that saw a decline. While the list reflects a broad range of sectors, each category contributes differently to the overall index; it is not appropriate to conclude that there is a complete loss of control just because there are more categories with increases than those with declines. A more useful approach is to observe the changes in core sub-items, housing, and service prices over several consecutive months to identify which parts represent short-term fluctuations and which have become more persistent costs.
The housing index has continuously increased from 0.3% in August to 0.4% in September, which is a change that needs to be monitored. Housing accounts for a significant weight in the CPI basket, so even minor differences in a single month can affect the overall trend; however, statistics on rent and equivalent rent for homeowners have their own lag, and they do not represent the immediate prices of newly signed leases for that month. Comparing housing data directly with the quotes on real-time rental platforms often leads to the false contradiction that "official data is not accurate." A more prudent approach is to acknowledge that the two sets of data are sampled in different ways and then observe whether there is a similar trend in the coming months.
A price report cannot be directly interpreted as a decision on interest rates.
Inflation data affects policy discussions, but it does not mechanically trigger a certain interest rate action. Central banks also need to consider employment, wages, consumption, financial conditions, and expectations; market transaction prices reflect investors' various speculations about these factors. After the release of CPI, immediate fluctuations in stocks or bonds are a reaction, not evidence that officials have already made a decision. Especially when the overall index rises significantly due to energy costs while the core index remains unchanged month-on-month, policy interpretation becomes more complex. Equating “3.7% year-on-year in September” directly with “an interest rate hike is certain next time” or “there is no hope of a rate cut at all” goes beyond what the data can support.
For ordinary families, rising prices do not mean that every expense increases by the same amount. Those who commute by car are more directly affected by fluctuations in gasoline prices, while those who rely on public transportation have a different structure of their bills; people who cook at home and those who eat out frequently also have very different experiences regarding the food index. Averages are used to observe national prices, not the individual inflation rates of each family. When comparing one's own expenses, it is appropriate to list major items such as transportation, rent, and healthcare according to their expenditure weights, rather than using a single overall index to explain each receipt.
Also, note two common numerical pitfalls: the 0.6% monthly year-on-year (yoy) increase reported by officials is seasonally adjusted, while the 3.7% yoy increase is not seasonally adjusted; it is meaningless to compare them on the same basis. A yoy increase of 3.7% does not mean that prices will rise by 3.7% in that month alone, and a month-on-month increase of 0.6% does not imply that prices will continue to rise at the same rate for the next eleven months. Even when annualized, this can only be considered a hypothetical scenario and should not be taken as the actual annual result.
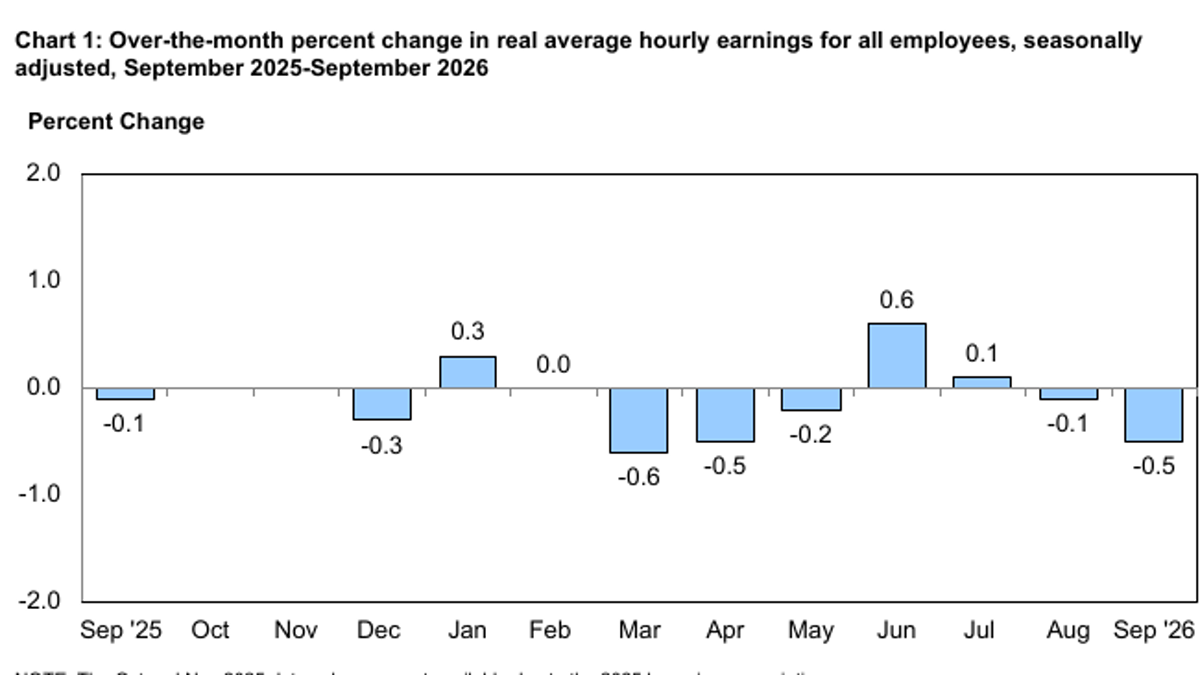
Next, the three signals that deserve the most attention are: whether energy prices will fall or spread to transportation services, whether housing and core services will continue to accelerate, and whether nominal wages will be able to cover living costs. On the same day, the Bureau of Labor Statistics also released a report on real income, which addresses the issue of purchasing power, while CPI only addresses how prices themselves change. Separating these two issues is necessary to avoid overinterpreting the same set of numbers. The September report has already confirmed an increase in price hikes and also confirmed that gasoline accounted for more than half of the monthly total increase; regarding future inflation trends and policy choices, it remains a snapshot rather than a final judgment.
For consumers of market information, another way to verify is to distinguish between initial releases and subsequent revisions. The CPI parts of the seasonally adjusted series may be revised in the annual updates, and the data for the last ten to twelve months in the chained CPI series may also be adjusted. Therefore, when looking back at the trends in September in the future, one should use the version released at that time to discuss market reactions, and the updated series to discuss long-term trends. These two approaches are not contradictory; however, mixing different versions of data can easily create the illusion that "the predictions from that time do not match today's charts."