Brief
Bitcoin traded at $82,164, slightly above a key support level. Earlier in the day, it reached $83,040 before giving back some of its gains.
Oil prices are approaching $108, inflation rates are at 3.7%, and the yield on 10-year U.S. Treasury bonds is above 5%. These factors continue to fuel market concerns about interest rate hikes; meanwhile, spot Bitcoin ETF has seen an outflow of approximately $910 million over the past two weeks.
Technical indicators on the chart suggest that traders should remain cautious in the short term.
Bitcoin continues to deviate from the seasonal " Uptober " expectations, with macroeconomic factors exerting significant pressure on this digital asset.
On Monday, Bitcoin hovered around $82,000, rising by about 1% during the day. Earlier in the session, it briefly touched $83,000 before giving back some of its gains.
After attacks on oil tankers in the Persian Gulf and Russian crude oil facilities over the weekend, the global benchmark Brent crude oil price approached $108 per barrel. High oil prices will drive up fuel and transportation costs, which in turn will contribute to inflation. The Consumer Price Index ( CPI ) – that is, the prices paid by households – rose by 3.7% year-on-year in September; the Producer Price Index ( PPI ) – that is, the prices paid by businesses – soared by 6.3%, marking the largest annual increase since 2022.
This is likely to push the Federal Reserve towards raising interest rates, making borrowing costs higher. The market believes that the probability of a 25-basis-point rate hike next week is about 15%. This is also reflected in the yields of U.S. Treasury bonds—yields are the return that investors receive for lending money to the U.S. government: when bets on rate hikes increase, bond prices fall and yields rise. CNBC data shows that the yield on 10-year U.S. Treasuries is 5.08%, and for 2-year bonds, it is 4.72%.
A nearly risk-free 5% yield rate will compete with stocks and cryptocurrencies for the same funds, and at the same time, it will also increase the debt costs of those AI giants that have taken on large amounts of debt for data centers. Bitcoin trades in the same direction as such risky assets; therefore, sell-offs in the AI sector often drag down Bitcoin.
The pressure is mainly concentrated on those companies that rely on borrowing to finance the construction of AI. The Nasdaq Composite Index fell more than 2% on Friday, recording its worst weekly performance since June; AMD fell 6% on that day, and Micron declined by 5.6%. The so-called “neocloud” – those that rent out AI computing power – fell by about 24% within a week, and their data center expenditures rely heavily on debt and new share offerings, rather than operating cash flow.
Higher inflation and higher yields will increase the holding cost of such debt, so what is happening in the stock market with selling off is actually the same story as what is happening in the bond market.
Bitcoin Price: Technical Analysis
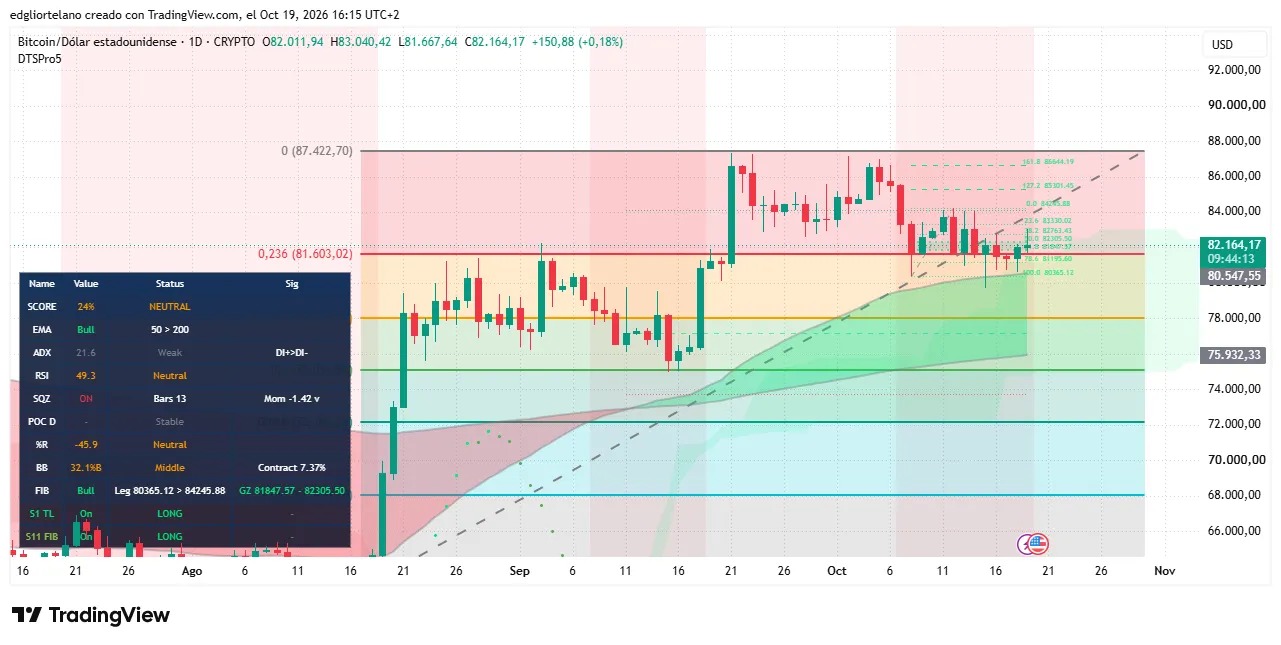
On the daily chart, Bitcoin is trading at $82,164, up 0.18% from the current candlestick chart. It is precisely at the 0.236 Fibonacci retracement level of $81,603. Fibonacci levels are often used to indicate potential pause points for pullbacks, and 23.6% is considered the weakest of these levels; therefore, holding this level indicates that the upward trend that began at the high of $87,422 is still intact. However, the strength of this rebound is not strong: consecutive weeks of small-bodied candles suggest that neither bulls nor bears have control of the market.
The current price of Bitcoin is also within the "golden zone" of $81,847 to $82,305, which falls within the recent fluctuation range of $80,365 to $84,246. Buying orders often appear in this area.
The 50-day exponential moving average ( EMA ) assigns a higher weight to recent prices, currently around $80,548, which is higher than the 200-day EMA at around $75,932. The current price is also above both of these moving averages. This pattern is known as a "golden cross" and is generally considered bullish, as it indicates that short-term buyers are paying a higher price than long-term holders.
However, in the absence of a clear trend, Squeeze Momentum Indicator has been in an "on" state for 13 consecutive days, which means that volatility has been compressed like a spring. The momentum indicator is -1.42, slightly trending downwards.
If the daily close falls below $81,603, it could open the way for $81,196 and the 50-day EMA. Bulls, on the other hand, need to ensure the close stays above $83,330 and $84,246, preferably with ADX also showing upward momentum. Next week's Federal Reserve meeting, as well as this week's key earnings conference calls, including those from Meta and Tesla, will be important catalysts to watch for in the coming period.
Disclaimer
The views and opinions expressed by the author are for informational purposes only and do not constitute financial, investment, or other advice.