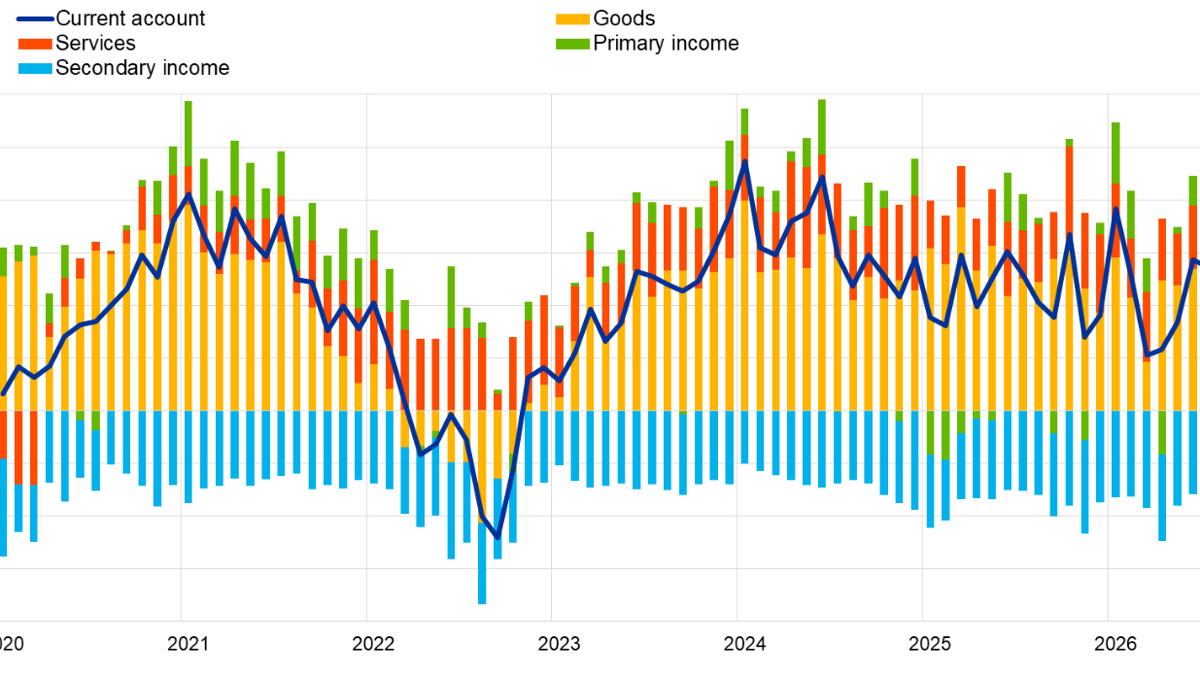


The current account surplus in the eurozone narrowed significantly in August. On October 20, the European Central Bank announced that after adjusting for working days and seasonality, the surplus for that month was 9 billion euros, down from 27 billion euros in July, a decrease of 18 billion euros on a month-on-month basis. This headline figure is intuitive, but it does not mean that the eurozone's external trade suddenly shifted from a surplus to a deficit, nor does it imply that capital has begun to flee the region. The current account combines goods, services, as well as cross-border income and transfer payments in the same account. If one only looks at the total amount, it is easy to misinterpret the meaning of each component.
The ECB's figures for August show: a trade surplus of 18 billion euros in goods, a trade surplus of 13 billion euros in services, a primary income deficit of 4 billion euros, and a secondary income deficit of 18 billion euros. There is a slight discrepancy between the sum of these sub-items and the total amount, which the central bank notes may be due to rounding. Goods and services still contribute positively, while the income items offset part of this surplus. Therefore, interpreting 9 billion euros as "Europe's exports are now only 9 billion" is inaccurate; this figure represents the net amount after offsetting various types of cross-border transactions.
Changes for the current month also need to be viewed within a longer time frame. Over the 12 months up to August, the eurozone's current account surplus amounted to 250 billion euros, which is approximately 1.5% of the region's GDP; in the same period last year, it was 290 billion euros, accounting for 1.8% of GDP. According to the central bank, the reduction in the surplus mainly stemmed from a decrease in the goods surplus from 320 billion euros to 290 billion euros, as well as an expansion in the secondary income deficit from 179 billion euros to 207 billion euros; the increase in the services surplus and primary income surplus offset these two changes. The comparison here is based on a rolling 12-month period, rather than simply multiplying the August figures by 12.
A quarterly "strength or weakness assessment" cannot be determined by the net amount of a single month.
A current account surplus is often regarded as a thermometer of a country or region's external economic relations, but it is not a simple one-dimensional metric where the larger the surplus, the better, or the smaller the surplus, the worse. A surplus may reflect the competitiveness of goods and services, or it may indicate relatively insufficient domestic investment or consumption; a reduction in the surplus could stem from weakened exports, or it could also be due to residents and businesses increasing imports and improved domestic demand. To assess this change, it is necessary to track goods, services, energy costs, external demand, and income payments, rather than simply equating a decrease in the surplus with an economic deterioration.
In August, the goods surplus remained at 18 billion euros, and the service surplus was 13 billion euros, indicating that physical trade and cross-border services as a whole have not lost their net inflow status. At the same time, the secondary income deficit amounted to 18 billion euros, a figure comparable to the goods surplus, reminding readers that cross-border transfer payments also affect the final figures. Monthly accounts can also be influenced by invoice settlements, holidays, and corporate payment timing. Although the central bank has made adjustments for seasonality and working days, it is still not possible to eliminate all one-time disruptions; therefore, a 12-month rolling period is more suitable for observing trends, while a single month is better for identifying changes that require explanation.
The structure within the rolling data is also worth examining. The trade surplus in goods decreased by 30 billion euros year-on-year, while the service surplus increased from 140 billion euros to 153 billion euros. Although it is convenient to refer to both together as "exports," the underlying industrial and policy implications are different: trade in manufactured goods, tourism, transportation, digital services, and professional services are driven by various demand and price factors. The primary income surplus increased from 9 billion euros to 14 billion euros, reflecting net inflows of income from overseas investments and labor; secondary income, on the other hand, usually involves transfers that are not exchanged for direct goods or services. Only by clarifying the nature of these accounts can we avoid attributing all the differences solely to factory orders.
Current account data is also subject to revision. Cross-border transactions between multinational corporations and financial institutions are complex, and historical figures may be adjusted after statistical agencies receive more complete reports. What the European Central Bank has disclosed this time are official estimates as of the time of the announcement, which are suitable for comparing trends under the same criteria, but not suitable for mechanical subtraction with uncalibrated data from different statistical agencies. If revisions to the August figures are discovered in the future, it does not necessarily mean that there was an "error" in the initial release; it is more likely a common supplement of information in balance of payments statistics.
The capital account presents another aspect, but traffic cannot be regarded as a stock.
The financial accounts disclosed by the European Central Bank during the same period provide another clue: over the 12 months to August, residents of the eurozone netted a purchase of 798 billion euros in securities outside the zone, while non-residents netted a purchase of 1.105 trillion euros in eurozone securities. These are transaction volumes over a certain period, not the stock of "how much euro assets foreigners hold" at a particular point in time, nor can one directly infer the inevitable rise or fall in exchange rates from these two totals. Securities include both equities and bonds, and holders may also hedge against exchange rate risks; in addition, transaction settlement and asset valuation can also affect market performance.
Looking at the details, residents of the eurozone net purchased 580 billion euros in bonds outside the zone, which is lower than the 634 billion euros in the same period last year; non-residents net purchased 659 billion euros in eurozone bonds, which is higher than the previous 412 billion euros. Non-residents also net purchased 446 billion euros in eurozone equities, which is also higher than the 419 billion euros in the same period last year. These changes indicate that cross-border portfolio investments are very active, but it is not possible to assert that a certain type of capital is "permanently flowing back" without information on yields, risk preferences, and the issuance structure. In financial markets, cross-border transactions correspond to current account payments and receipts through various channels, but each set of figures has its own statistical definition.
For businesses, the most practical indicators to observe are external demand and the supply chain. A narrowing trade surplus may suggest increasing competition in exports and changes in the structure of energy prices and imports. However, to make business decisions, it is also necessary to consider data on commodity trade, industrial production, and orders from the European Union Statistics Office. For investors, trends in the current account may affect their perception of the external resilience of the eurozone, but they cannot replace analysis of the policies of the European Central Bank, global interest rate spreads, and risk sentiment. In news reports, macroeconomic figures are often categorized simply as "good" or "bad," but in reality, they are more like a bill that awaits further breakdown and analysis.
What can be confirmed from this release is that in August, there was still a current account surplus, although it was significantly lower than in July; the 12-month rolling surplus was also below the same period last year, mainly affected by goods and secondary income items. The next step is to see if this narrowing trend continues in subsequent months, as well as whether goods trade and service exports can maintain their respective contributions. Until these evidences become available, it is not appropriate to declare an external imbalance based on single-month figures, nor should we ignore structural changes just because there is still a surplus.
Source: European Central Bank " Euro area monthly balance of payments : August 2026", October 20, 2026 https :// www.ecb.europa.eu / press / stats / bop /2026/ html / ecb.bp261020 ~679813bbc5. en.html